
Data Analytics Explained: From Raw Data to Informed Business Decisions
Need quick insights? Summarize with AI & save time
 ChatGPT
 Perplexity
 Claude
 Google AI Mode
Table of Contents
- What are the Types of Data Analytics?
- What are the Steps to Embed Data Analytics in Business Processes?
- What are Applications of Data Analytics?
- How can Businesses Ensure that their Data Analytics Effort Serves their Growth Goals?
- What are the Best Data Analytics in Business Practices?
- What are the Most Common Data Analytics in Business Challenges?
- Conclusion
- FAQs
Summary :
Data has become the backbone for any business, with every transaction, click, and abandoned cart adding to it. This scenario has led to a pile of information that modern businesses often struggle to use. As the market is becoming more competitive, making decisions on the basis of instincts results in missed opportunities and increased costs.
Data analytics in business examines large datasets and traces patterns, which enables organizations to predict the next steps. As a result, the teams are able to make data-driven decisions.
This blog is a practical guide for businesses to convert raw data into valuable insights.
Most businesses have access to heaps of data. Every customer interaction is a point of data collection, and every organization is investing heavily to make use of the data. However, this raw data will not be able to predict customers’ next step. Without an effective way to make use of the data, even the largest data stores sit idle, and when it is time to launch a product or change strategy, businesses are often short of the required intelligence.
This is the gap that data analytics is meant to close. Data analytics in businesses turns this raw, scattered data into actionable insights. Without it, organizations are paying heavily to collect and store data but are driving very little to no value from it. The costs show up as missed opportunities, slow responses to market changes, and investments that never pay off, while leaders are constantly under pressure to show that data is driving significant impact.
What are the Types of Data Analytics?
Data analytics in business is the process of assessing raw data to identify patterns, explain outcomes, and accelerate informed business decisions. Not every business question has the same kind of answer; therefore, data analytics is divided into different types.
- Descriptive Analytics: Summarizes historical data into dashboards, reports, and key metrics, making it easy for leaders to visualize data and make informed decisions. Example: A retailer experiences a drop in profit by 20%. The very next question would be: the profit is falling in which business function? With a custom-tailored dashboard, retailers can spot that the reduction is due to decreasing mobile orders.
- Diagnostic Analytics: Digs deeper into the available data to identify the root cause of the problem. The next question is: why are mobile orders decreasing? With diagnostic analytics, retailers can spot that the cart abandonment rate has increased from 55% to 72% after the website was updated last week. Due to the update, the site loading time has increased from 2 to 6 seconds.
- Predictive Analytics: Uses historical data, statistical models and machine learning to forecast future outcomes. This technique answers the question: what will happen if no action is taken. With predictive analytics, the retailer can determine that revenue is likely to fall by 15% and around 6,000 customers might not buy again.
- Prescriptive Analytics: Get the best course of action by combining recommendations with optimization, simulation and AI. The final question is how the business will recover. The recommendation is to fix the cart and send a targeted offer to the 6,000 customers and adjust the inventory levels before the holiday peak. The model estimates that businesses can recover most of the revenue.
What are the Steps to Embed Data Analytics in Business Processes?
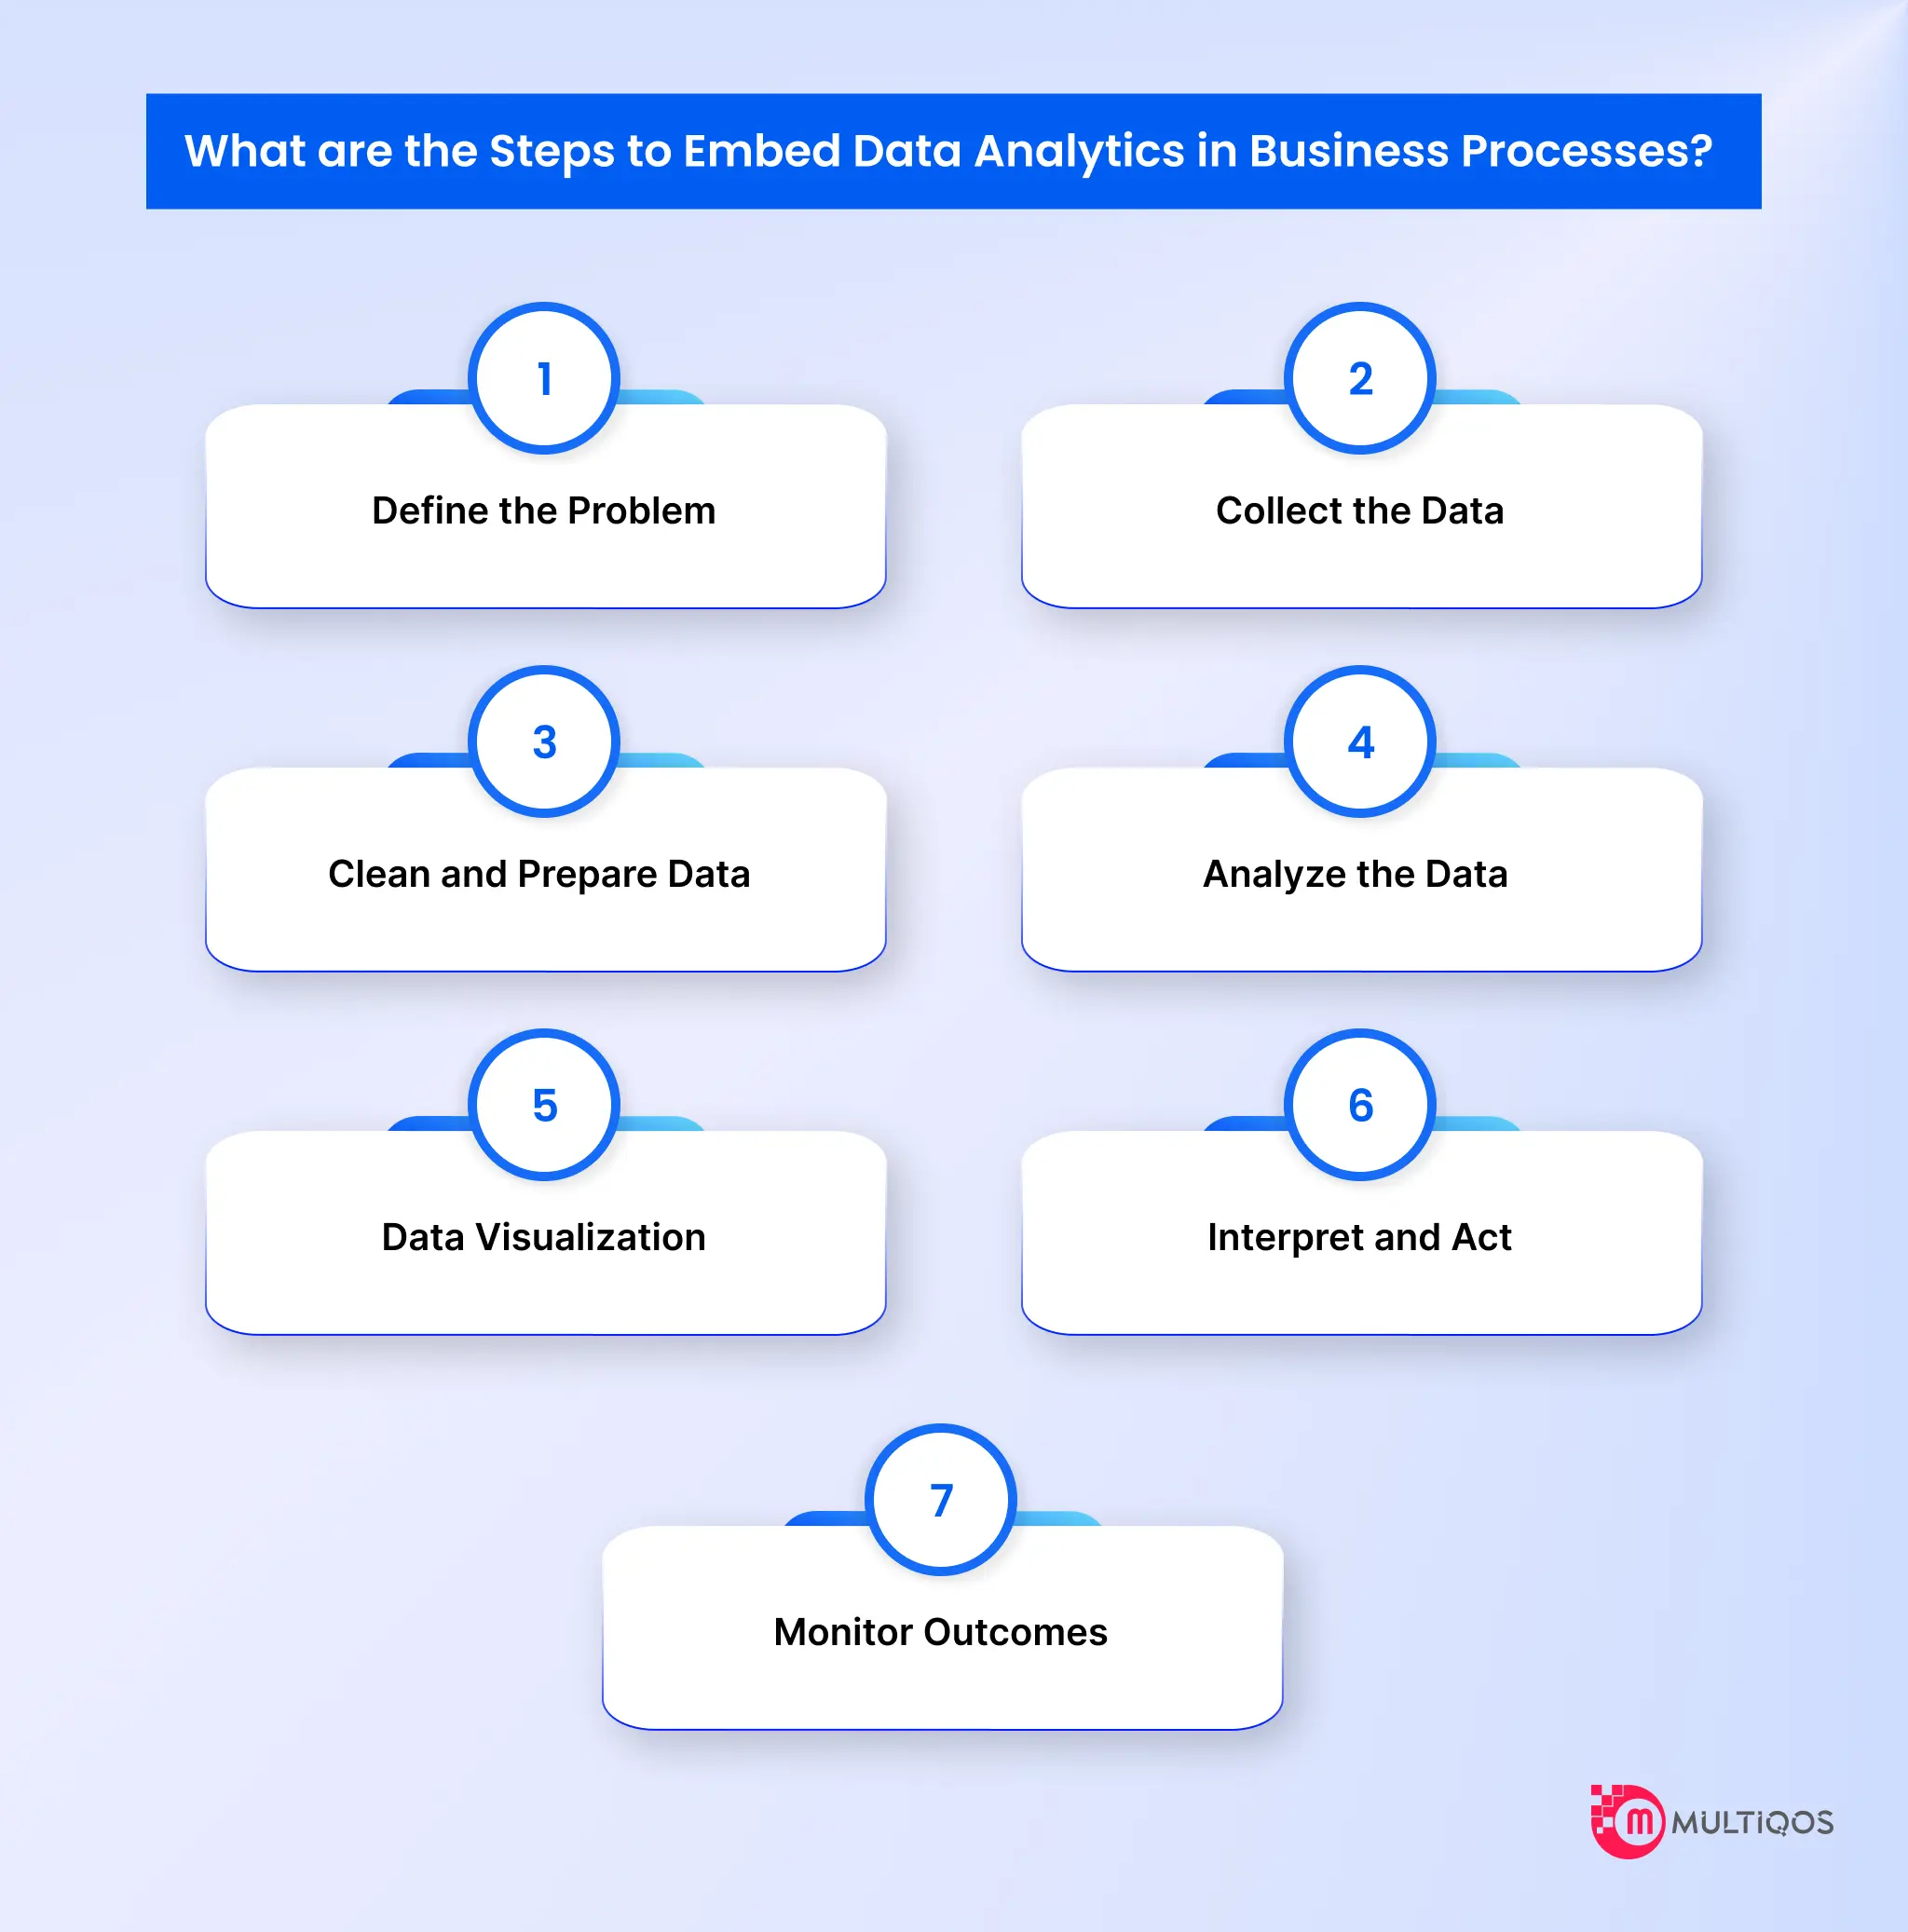
Businesses benefit the most from a phased data analytics implementation approach. As a series of steps is followed, it is ensured that desirable outcomes are delivered. Below are the seven steps that guarantee an enterprise-grade data analytics process.
-
Define the Problem
A successful analytics project begins with a clear question and not a dataset. Sponsors, functional leaders, and analytics leaders work together to define the scope of work, formulate KPIs, and determine what could be the cost of inaction. Describing the problem from the start ensures that the concerned teams remain focused on achieving the KPIs, spotting activities that impact revenue and reduce costs.
-
Collect the Data
Once the goals are defined, the teams pull data from internal and external sources. Internal data typically comes from SQL databases, customer interaction logs, ERP records, and transaction histories, while external resources can include market indices, consumer research panels and third-party APIs.
-
Clean and Prepare Data
Raw data collected from legacy infrastructure is rarely available for further analysis. It often has mismatched records, duplicate entries, and missing values. Cleaning and preparing the data for analytics processes is a time-consuming job, as it involves deduplication, schema normalization, outlier detection, and restructuring. Enterprises with a tailored data analytics framework maintain data lineage and avoid bad data from undermining downstream statistical models.
-
Analyze the Data
Once the clean datasets are hosted in data lakes and warehouses, data specialists apply statistical and mathematical techniques to discover what the numbers reveal today. Teams typically begin with exploratory data analysis to understand baseline distributions and correlations. From there, they choose methods suited to business objectives such as linear regression, time-series forecasting, clustering, or classification algorithms. This stage surfaces systemic patterns, identifies the root cause of the problem, and produces forward-looking estimates.
-
Data Visualization
The data should be represented in an easy-to-understand format. The best data visualization practices should be followed to ensure that the charts, reports and dashboards are designed to offer a clear picture of the business activities.
-
Interpret and Act
The impact from a data analytics project can only be experienced when a commercial team can convert the insights into operational initiatives. At this stage, the business analysts translate technical results into strategic recommendations, and cross-functional teams assess feasibility, capital needs, and risks of every section. Whether the goal is optimizing regional supply chain distribution, adjusting consumer credit limits, or refining the market spend, this step bridges the gap between statistical insights and executive action.
-
Monitor Outcomes
The final step that closes the analytical feedback loop. Enterprise teams track the results of implemented changes against the baseline KPIs set in step one, confirming if the models stay accurate or begin to suffer as the data starts to drift. The data from this stage is fed back into the first phase, driving continuous operational refinement.
What are Applications of Data Analytics?
Enterprise data analytics is most valuable when applied to concrete business decisions rather than abstract analysis. Use cases typically center on revenue, risk, efficiency, and strategic planning. Some of these data analytics in business use cases are highlighted below
-
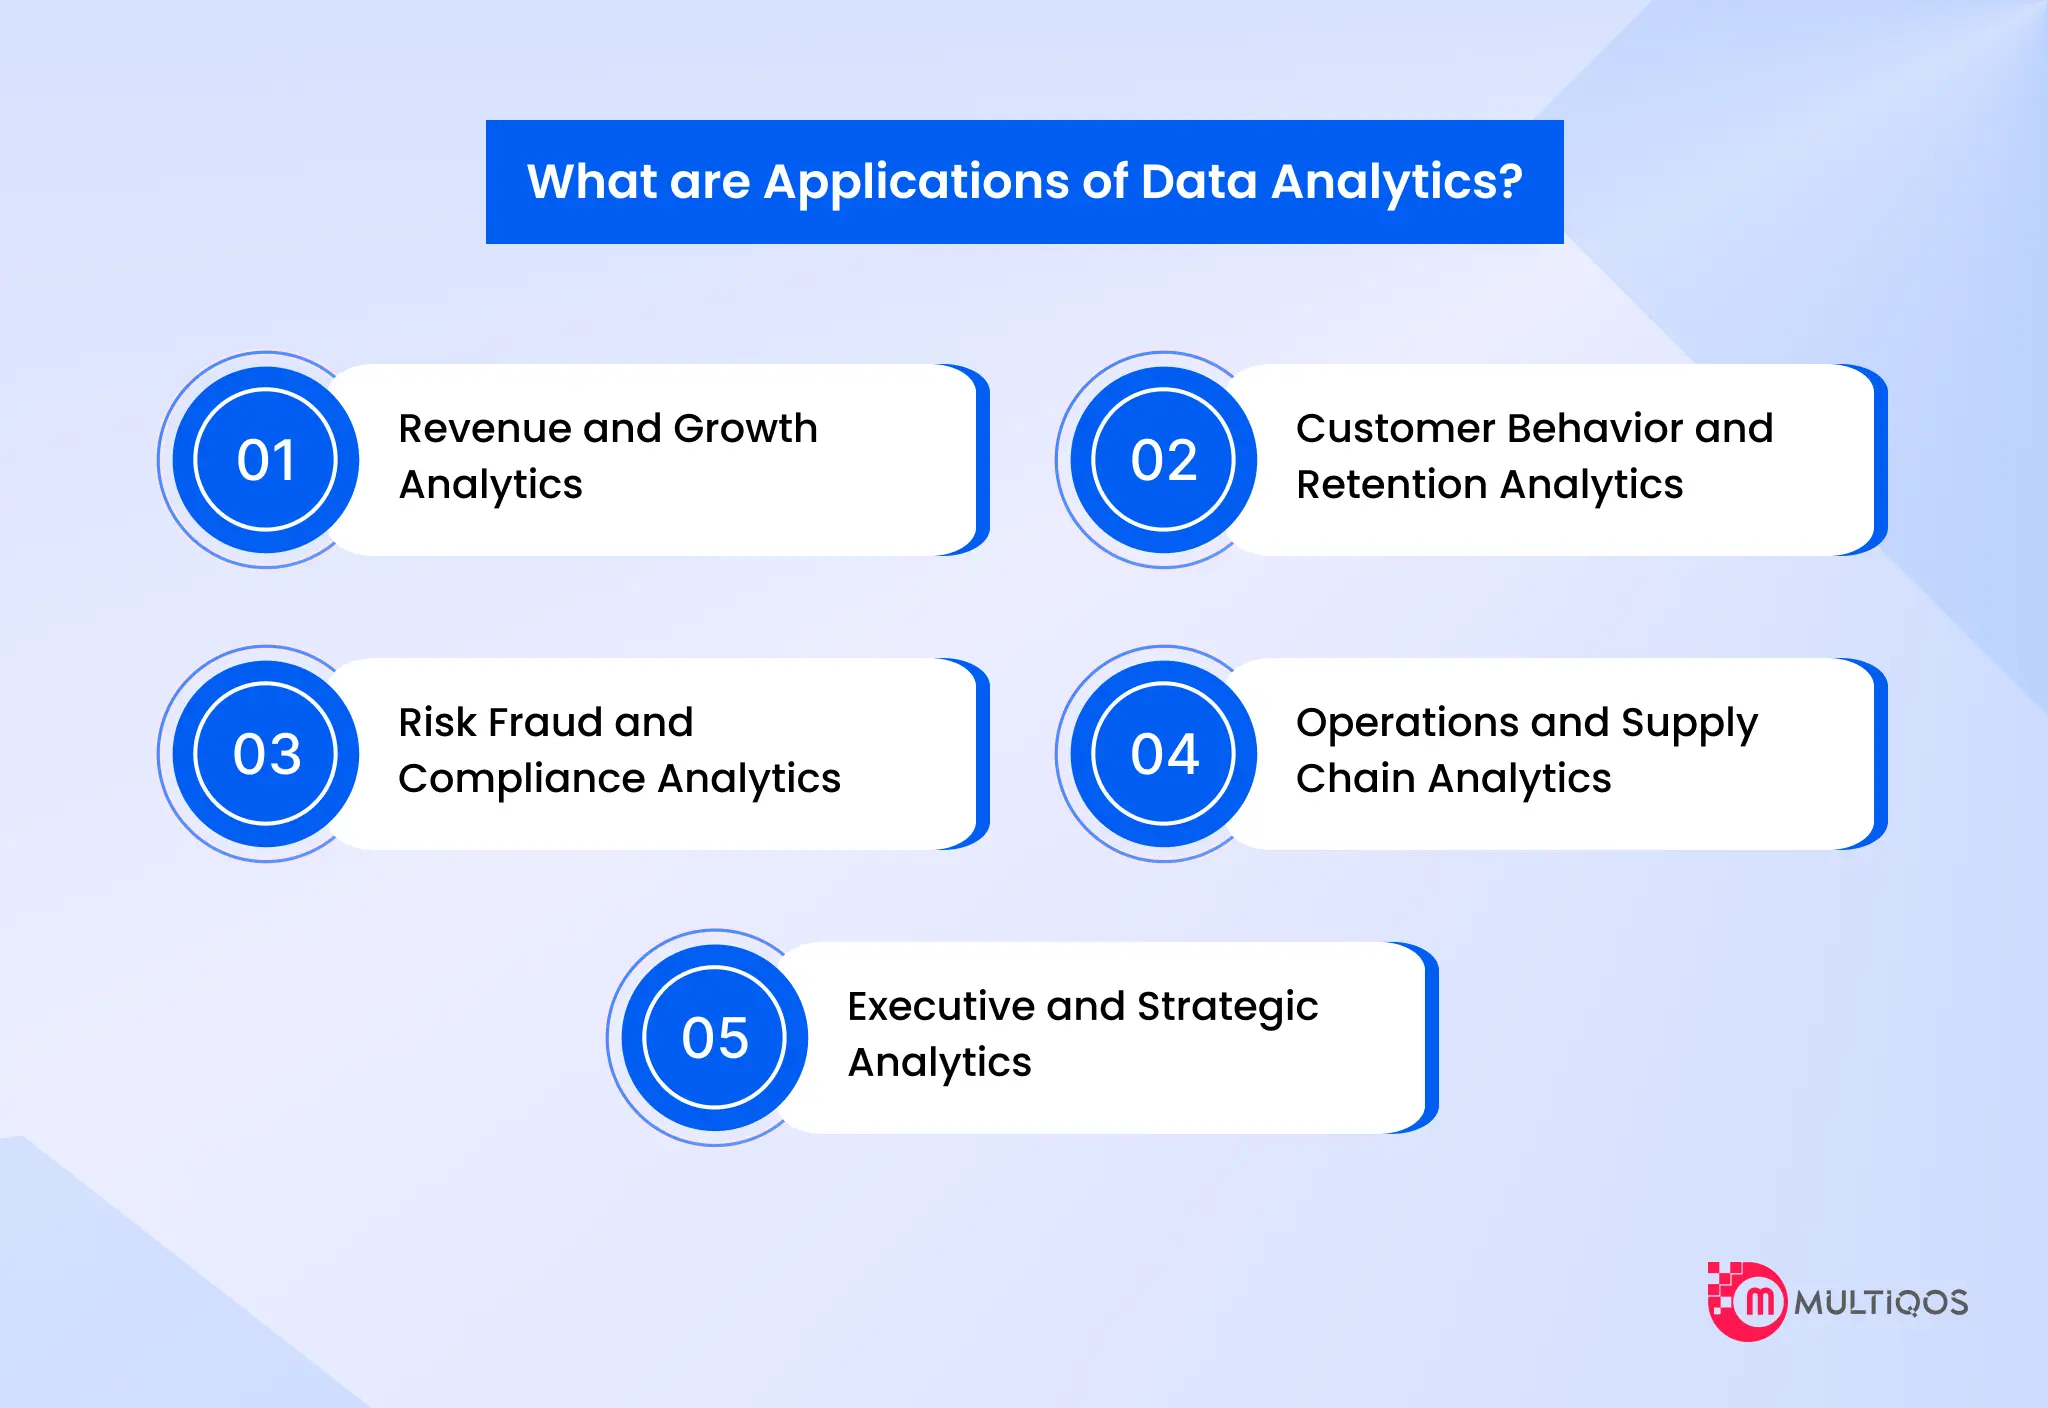
Revenue and Growth Analytics
Enterprise analytics help sales and finance teams track pipeline health, conversion rates, and revenue trends, showing where growth is speeding up or stalling across regions and customer segments. It supports pricing and margin decisions by revealing how price changes, discounts, and shifting costs affect profitability, so leaders can stay competitive without sacrificing margins.
Example: A B2B software company can use data analytics to monitor deal velocity and discounting patterns across its sales pipeline. By seeing which deals close fastest, where heavy discounts are being used to win business, and how those discounts affect long-term account value, leaders can pinpoint where pricing is aggressive or too rigid. This lets them adjust pricing strategies, such as tightening discount approvals or adding value-based tiers, in a way that protects margins without pushing customers away. Tracking renewal and churn data alongside these changes helps confirm price adjustments improve profitability without increasing customer churn.
-
Customer Behavior and Retention Analytics
Enterprises analyze different signals such as purchase history, usage patterns, and engagement signals to understand and predict the behavior of customer groups. The analytics also highlight customer churn, enabling teams to intervene and take remedial measures before the customers leave.
Example: A US telecommunications provider can use analytics to examine the service usage patterns and support client communication simultaneously. With easy access to the data regarding dropped calls, billing disputes, declining usage, and repeated support contracts, the company spots early warning signs that a customer might be considering leaving. The teams can therefore step in with retention offers, service upgrades, or priority support outreach. Over time, tracking which retention strategy is working allows companies to reduce churn and improve customer loyalty.
-
Risk Fraud and Compliance Analytics
Financial and compliance teams use analytics to spot risk indicators across portfolios, transactions, and operations in real time. The teams can identify emerging exposure early and take the required steps to avoid compliance violations. By studying the datasets, anomalies can be detected as deviations are flagged. Suspicious cases are routed to the investigators, cutting losses and wasted time on false positives.
Example: A financial institution uses analytics to monitor transaction behavior across different accounts and create alerts for patterns that indicate money laundering. The deposits structured below the threshold, rapid movement across the accounts, and inconsistent activities with the customers’ profiles are some of these signals. This helps institutions adhere to their reporting obligations, and the investigating teams can continue focusing on the highest-risk cases.
-
Operations and Supply Chain Analytics
Data analytics in business spots inefficiencies and bottlenecks across different departments, enabling companies to improve resource utilization and reduce downtime. The same approach is extended to the supply chain, where analytics support planning, inventory optimization, and supplier performance tracking, giving teams proper visibility over the inventory and logistics operations.
Example: A manufacturing division can use analytics to examine production and logistics together, tracking machine downtime, line speeds, order backlogs, and carrier performance. By connecting these data points, the company can see where delays actually start, whether it’s a production bottleneck, a late supplier shipment, or a slow handoff to freight. Teams can adjust schedules, rebalance workloads, or switch carriers on problem routes before the orders slip. Over time, monitoring on-time delivery performance against these changes shows which fixes work, helping the company shorten lead times and meet customer requirements more reliably.
-
Executive and Strategic Analytics
Leadership teams use analytics to track high-level performance indicators across different business units and regions, giving them a complete picture of what is performing well and what is not. This visibility enables leaders to prepare separate business models and weigh trade-offs between them, such as expanding into a new region, adjusting investment levels, or responding to market shifts that might affect results.
Example: A US retail enterprise can use analytics to evaluate an expansion scenario before committing capital. By modeling projected revenue for each option, such as opening stores in new regions, growing existing markets, or taking the online route, and comparing it against expected costs such as real estate, staffing, and inventory, the leaders can decide which option to choose.
How can Businesses Ensure that their Data Analytics Effort Serves their Growth Goals?
A mismatch between business goals and data analytics strategy can incur losses. Organizations may be collecting data that is of no use, and it might happen that the teams don’t have access to the treasure trove of data.
-
Data Usage
The organizations need to determine where the data will be used exactly. The data analytics in the business should be used to accelerate informed decisions. The data analytics strategy should be reviewed regularly to find gaps and figure out the next steps to improve progress towards key business goals. For instance, CRM automation can automate routine tasks such as data entry and syncing while generating insights into customer behavior.
-
Source Identification
Companies should verify the purpose and source of the data before building a data analytics strategy around it. They need to map where the data is stored and who has access rights. With the rise in cybersecurity breaches, businesses must clarify to customers how and where they use data.
-
Maturity Examination
Data maturity is the level at which a company stores, collects, and analyzes data. A company with high data maturity usually involves employees across all departments to contribute to the data analytics strategy. These businesses encourage employees to learn different tools such as Microsoft Azure, which helps with data analysis. Another indicator is the data backup strategy. Businesses have access to sensitive customer information, which should be backed up and secured properly. Organizations that don’t have a detailed security plan should make one, as data leaks damage business reputation and customer trust.
-
ROI Calculation
A data strategy should be judged for the ROI on the basis of time and money saved. The goals that deliver the highest ROI or those that data can speed up the most and weigh whether they already have the needed data or need the technology to collect, store and analyze it. The companies should also decide whether they should hire a new team or host training sessions for the existing employees.
-
Employee Communication
The employees should be aware of the data analytics strategy. It might happen that with a data analytics strategy in place, processes might change a bit. Therefore, the teams need to be trained if needed. This gives employees easy access to the relevant data, supports clear communication and saves storage space by avoiding multiple copies of the same datasets.
What are the Best Data Analytics in Business Practices?
Data analytics succeeds only when it is treated as a long-term capability and not as a collection of different isolated projects. Many organizations invest heavily in the data analytics tools and software yet still struggle to deliver results because the foundational practices are missing. Mature analytic programs are centered around clarity, ownership and sustainability. They put trust in data, alignment with real decisions, and operational discipline instead of experimentation alone.
-
Begin with Business Decisions
Before designing any metrics or reports, the businesses need to identify the decisions analytics is meant to support, so every insight is tied directly to revenue, risk, cost, or outcomes.
-
Define Clear Ownership for Data and Metrics
To ensure that the data quality is maintained across teams organizations should build a team that is solely responsible for assessing the data quality.
-
Apply Standardization Across Metrics and Definition
Organizations should establish clear and common definitions across different business functions such as finance, operations and leadership so that everyone interprets results the same way and conflicting readings are avoided.
-
Embed Governance into Analytics Workflow
Businesses should build data quality checks, access controls, and lineage tracking into their analytics processes from the start rather than treating it as an afterthought.
-
Design Analytics for Scale and Reuse
Organizations should build models and analyses that can be replicated across teams and use cases, reducing manual work and multiple efforts.

What are the Most Common Data Analytics in Business Challenges?
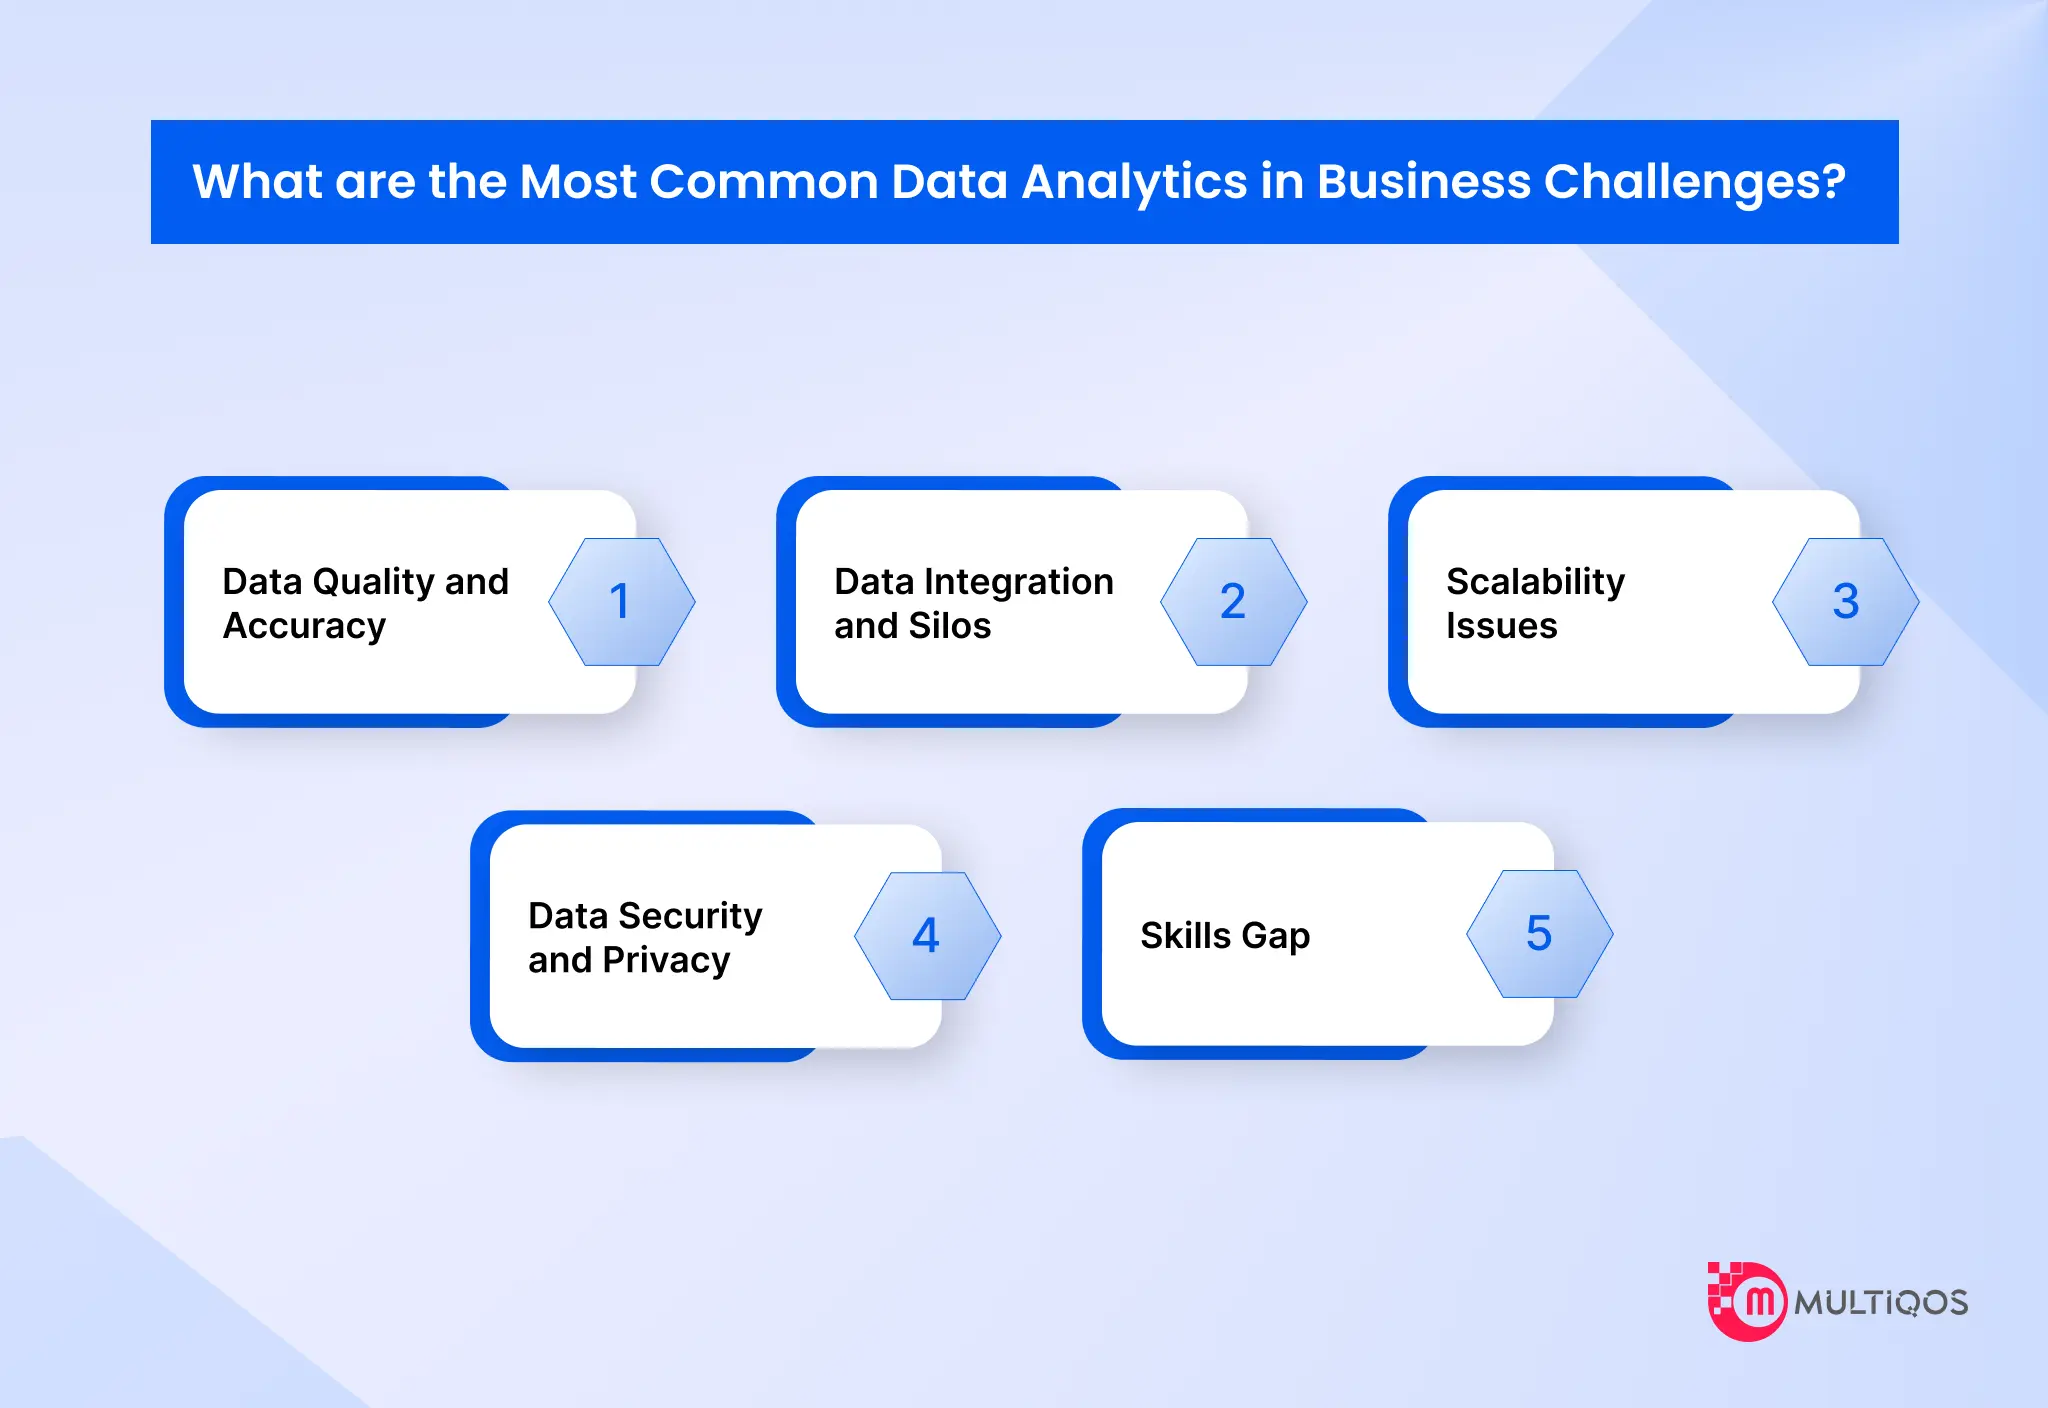
Data analytics offers a myriad of benefits to businesses of different sizes. However, its proper implementation is fraught with various challenges. Some of the most well-known challenges are
-
Data Quality and Accuracy
Data analytics efforts will only succeed if data is devoid of any inconsistencies and formatted properly. Therefore, determining the source of data is important. Organizations need to identify the quality, relevance, and accuracy of data sources.
-
Data Integration and Silos
After the data sources are identified, the datasets should be consolidated in a relevant repository. A strong data integration strategy is required to ensure that the datasets are unified in the required manner. Any mismatch in the data formats harms the data analytics efforts. The IT department must enable networks to support integration and transformation or cleansing of data, if required.
-
Scalability Issues
Data analytics projects often use extensive resources. The IT teams should be ready with a list in the data pipeline, starting from the consolidation and transformation of the data to storing it and running data analytics applications. The teams should also consider how the project affects the network. A heavy setup can make it hard to scale as the demand grows.
-
Data Security and Privacy
On the surface level, the data analytics application doesn’t act as a security threat. But when multiple pieces are consolidated, the security concerns might crop up. As data is exchanged constantly between two environments, defining role-based and user-based access becomes crucial. Privacy demands and compliance regulations present compliance issues. The entire organization needs to be trained in the basic protocols so that the threats can be traced and eliminated at the earlier stages. The attacks keep becoming sophisticated, so the IT teams need to keep updating themselves.
-
Skills Gap
Data analytics is rapidly growing, and so is the demand for professionals who do it. Skilled candidates are hired quickly at premium salaries; therefore, organizations need to be careful and swift with their hiring decisions.
Conclusion
Data analytics is not about having access to the data. It is about making use of the available data. The businesses that get real value from the data start with clear business questions, trust the value of data, and present concerned leaders with the available insights to initiate data-driven decisions. Tools and dashboards, certainly, are of great importance. However, these only pay off when data leads to action. Start small, pick one decision that is currently based on instinct, bring data to it, and build from there.
FAQs
The types of data analytics are the basic blocks of the process that enable businesses to turn raw data into informed decisions. These are descriptive analytics, diagnostic analytics, predictive analytics, and prescriptive analytics.
Data analytics in businesses assists leaders in converting data into actionable insights, shifting businesses from intuition-based to data-driven decision-making. For example, with a properly crafted data analytics strategy, the team can spot red flags, quantify hazards, and make reliable, risk-free decisions.
Small businesses don’t need big budgets to start their data analytics initiatives. They can start small with just one to two questions, use the already available data, evaluate the output, and then scale as per their requirements.
Businesses can start measuring the ROI by first recording the baseline for the metric that needs to be enhanced. Every analytics project should be tied to a business goal. Full costs, with gains in revenue, savings, and reduced losses, can be calculated using the formula: ROI = (Gain – Cost)/Cost * 100. The results should be checked against a control group and historical data regularly, because as the analytics scale, the results improve.
Data analytics is a process of collecting, cleaning, transforming, and examining data to uncover hidden insights, eliminate guesswork, and drive informed decisions.

Get In Touch

Get Stories in Your Inbox Thrice a Month.
Why Manual Data Pipelines Are a Silent Business Risk (And How Automation Fixes It)
Why Ethical Use of User Data in Software Matters More Than Ever