
10 Benefits of Using Power BI for Data-Driven Businesses: Turning Data Into Decisions
Need quick insights? Summarize with AI & save time
 ChatGPT
 Perplexity
 Claude
 Google AI Mode
Table of Content
- What is Power BI and Why It Matters for Data-Driven Businesses?
- 10 Power BI Benefits for Data-Driven Decision Making
- The Business Impact of Power BI: What to Expect?
- How to Get Started: A Practical Roadmap to Gain More Power BI Benefits
- Conclusion
Summary:
This piece outlines how Power BI solves the problem of delayed reporting by making siloed data “live, shared, and ready to act”. It explains that Power BI provides a unified semantic model to stop departmental data disputes and utilizes Microsoft Copilot so non-technical users can perform complex analysis using plain language. The article highlights 10 core benefits, including real-time reporting, self-updating dashboards, scalable data via Microsoft Fabric, and cost efficiency through consolidation. Finally, it details the business impact on ROI and provides a practical 5-step roadmap to launch a successful Power BI pilot.
The amount of data produced by companies is greater today than it has ever been. In organizations, most of it fails to get to the person who needs to do something about it and into the system. This is why only one-third of organizations are data-driven. Well then, the issue wasn’t so much the volume issue as access and speed.
A CFO waits for a consolidated revenue glimpse, which has already become out-of-date when it arrives. The ad hoc report requests build up before a BI manager, and the team can’t keep up with them. The board desires an answer right here and now.
Power BI fills the gap by making the data scattered and siloed “live, shared, and ready to act”. This piece covers what Power BI is, the top Power BI benefits, and what the ROI numbers actually mean, with a step-by-step roadmap to implement it.
What is Power BI and Why It Matters for Data-Driven Businesses?
Power BI is mostly seen as a charting application. It’s not. It’s the business intelligence layer offered by Microsoft, which pulls data from hundreds of different sources, makes interactive reports out of them, and delivers those reports to desktops, the cloud, and mobile devices without any need for rekeying any spreadsheets.
Power BI has now become four different ecosystems, including Power BI Desktop for report creation, Power BI Service for cloud delivery, Power BI Mobile for accessing reports when away from your computer, and Power BI Report Server for enterprises with on-premises data storage. On top of this stack is the Copilot AI layer and Microsoft Fabric for storage of everything in one place called OneLake.
That’s what. The reason it matters is more specific than “better dashboards.”
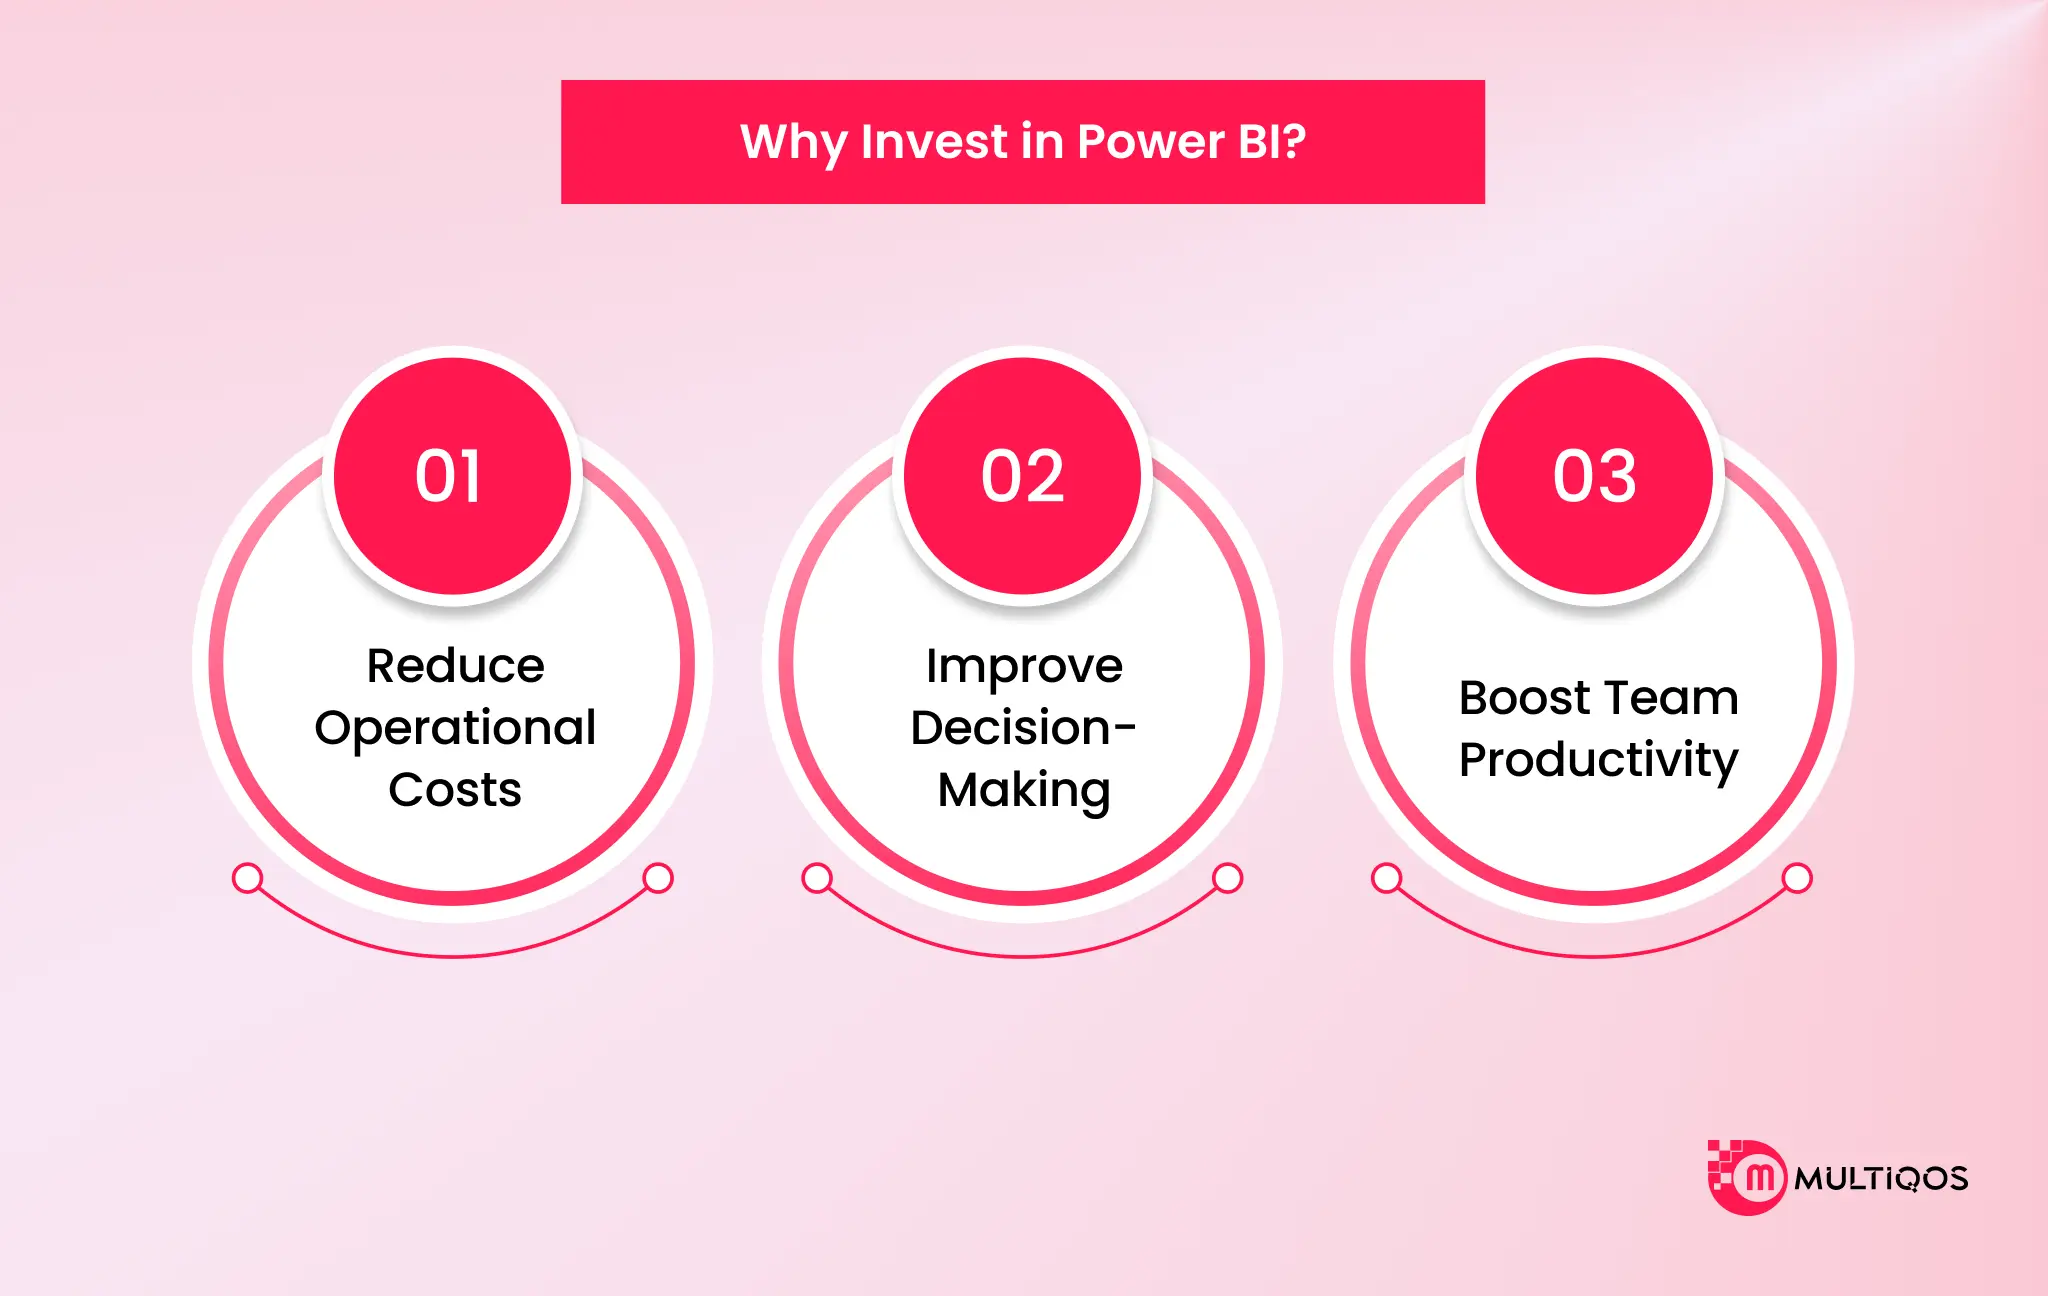
Why Power BI Earns a Line in the Budget?
Most reporting problems aren’t reporting problems. They’re definition problems. Two departments walk into a review with two versions of the same metric, and the meeting turns into a debate about math instead of a decision about action.
One of the key Power BI benefits is that its centralized semantic models settle that before anyone sits down. Everyone queries the same definition. Dashboards update live, so a manager watches a trend move rather than reading last month’s autopsy. Real-time visibility only helps if people trust the source, and a shared model is the one thing that earns that trust.
The Return Shows Up in Retired Tools, Not New Ones
Companies expect business intelligence to pay off through fancier analytics. It usually pays off by removing things. Retire a second vendor. Collapse the reporting stack. Let people pull their own data instead of routing every request through IT.
That last shift is the one leaders underrate. When non-technical staff can safely query pre-authenticated models, IT stops being a bottleneck and starts building the models everyone depends on. The platform doesn’t just add capability. It subtracts a cost you were already paying and never named.
Analysts Stop Assembling Data And Start Reading It
The expensive part of reporting was never the analysis. It was the assembly. Pulling, cleaning, stitching, formatting, and only then thinking about what any of it meant.
Automated refreshes flip that ratio. Reporting cycles that used to run for hours collapse to minutes, and the analyst’s time moves from manual data plumbing to the part you actually pay them for. Self-service does the same for everyone else. People answer their own questions from trusted models, and the queue outside the data team shrinks.
The AI Layer Is The Part That Changes The Workflow
Microsoft Copilot isn’t a gimmick bolted onto reporting. Ask “show total profit by region” in plain language, and it builds the query, writes the DAX, and hands back a narrative summary of what shifted. The skill barrier that kept analysis locked inside the data team starts to drop. This is important because Gartner reports 57% of organizations don’t have data AI-ready.
Then there’s the integration nobody demos well. Power BI lives inside Excel, Teams, and SharePoint, so a report isn’t a dead end. You spot the problem and trigger the business process from the same screen.
For heavy datasets, Direct Lake mode reads straight from the lake and returns answers without a slow refresh cycle. That combination, conversational analysis plus observe-to-act workflows, is where Power BI stops being a viewer and becomes an operating surface.
Picking the wrong reporting stack costs a fiscal year of bad decisions before anyone admits it isn’t working.
10 Power BI Benefits for Data-Driven Decision Making
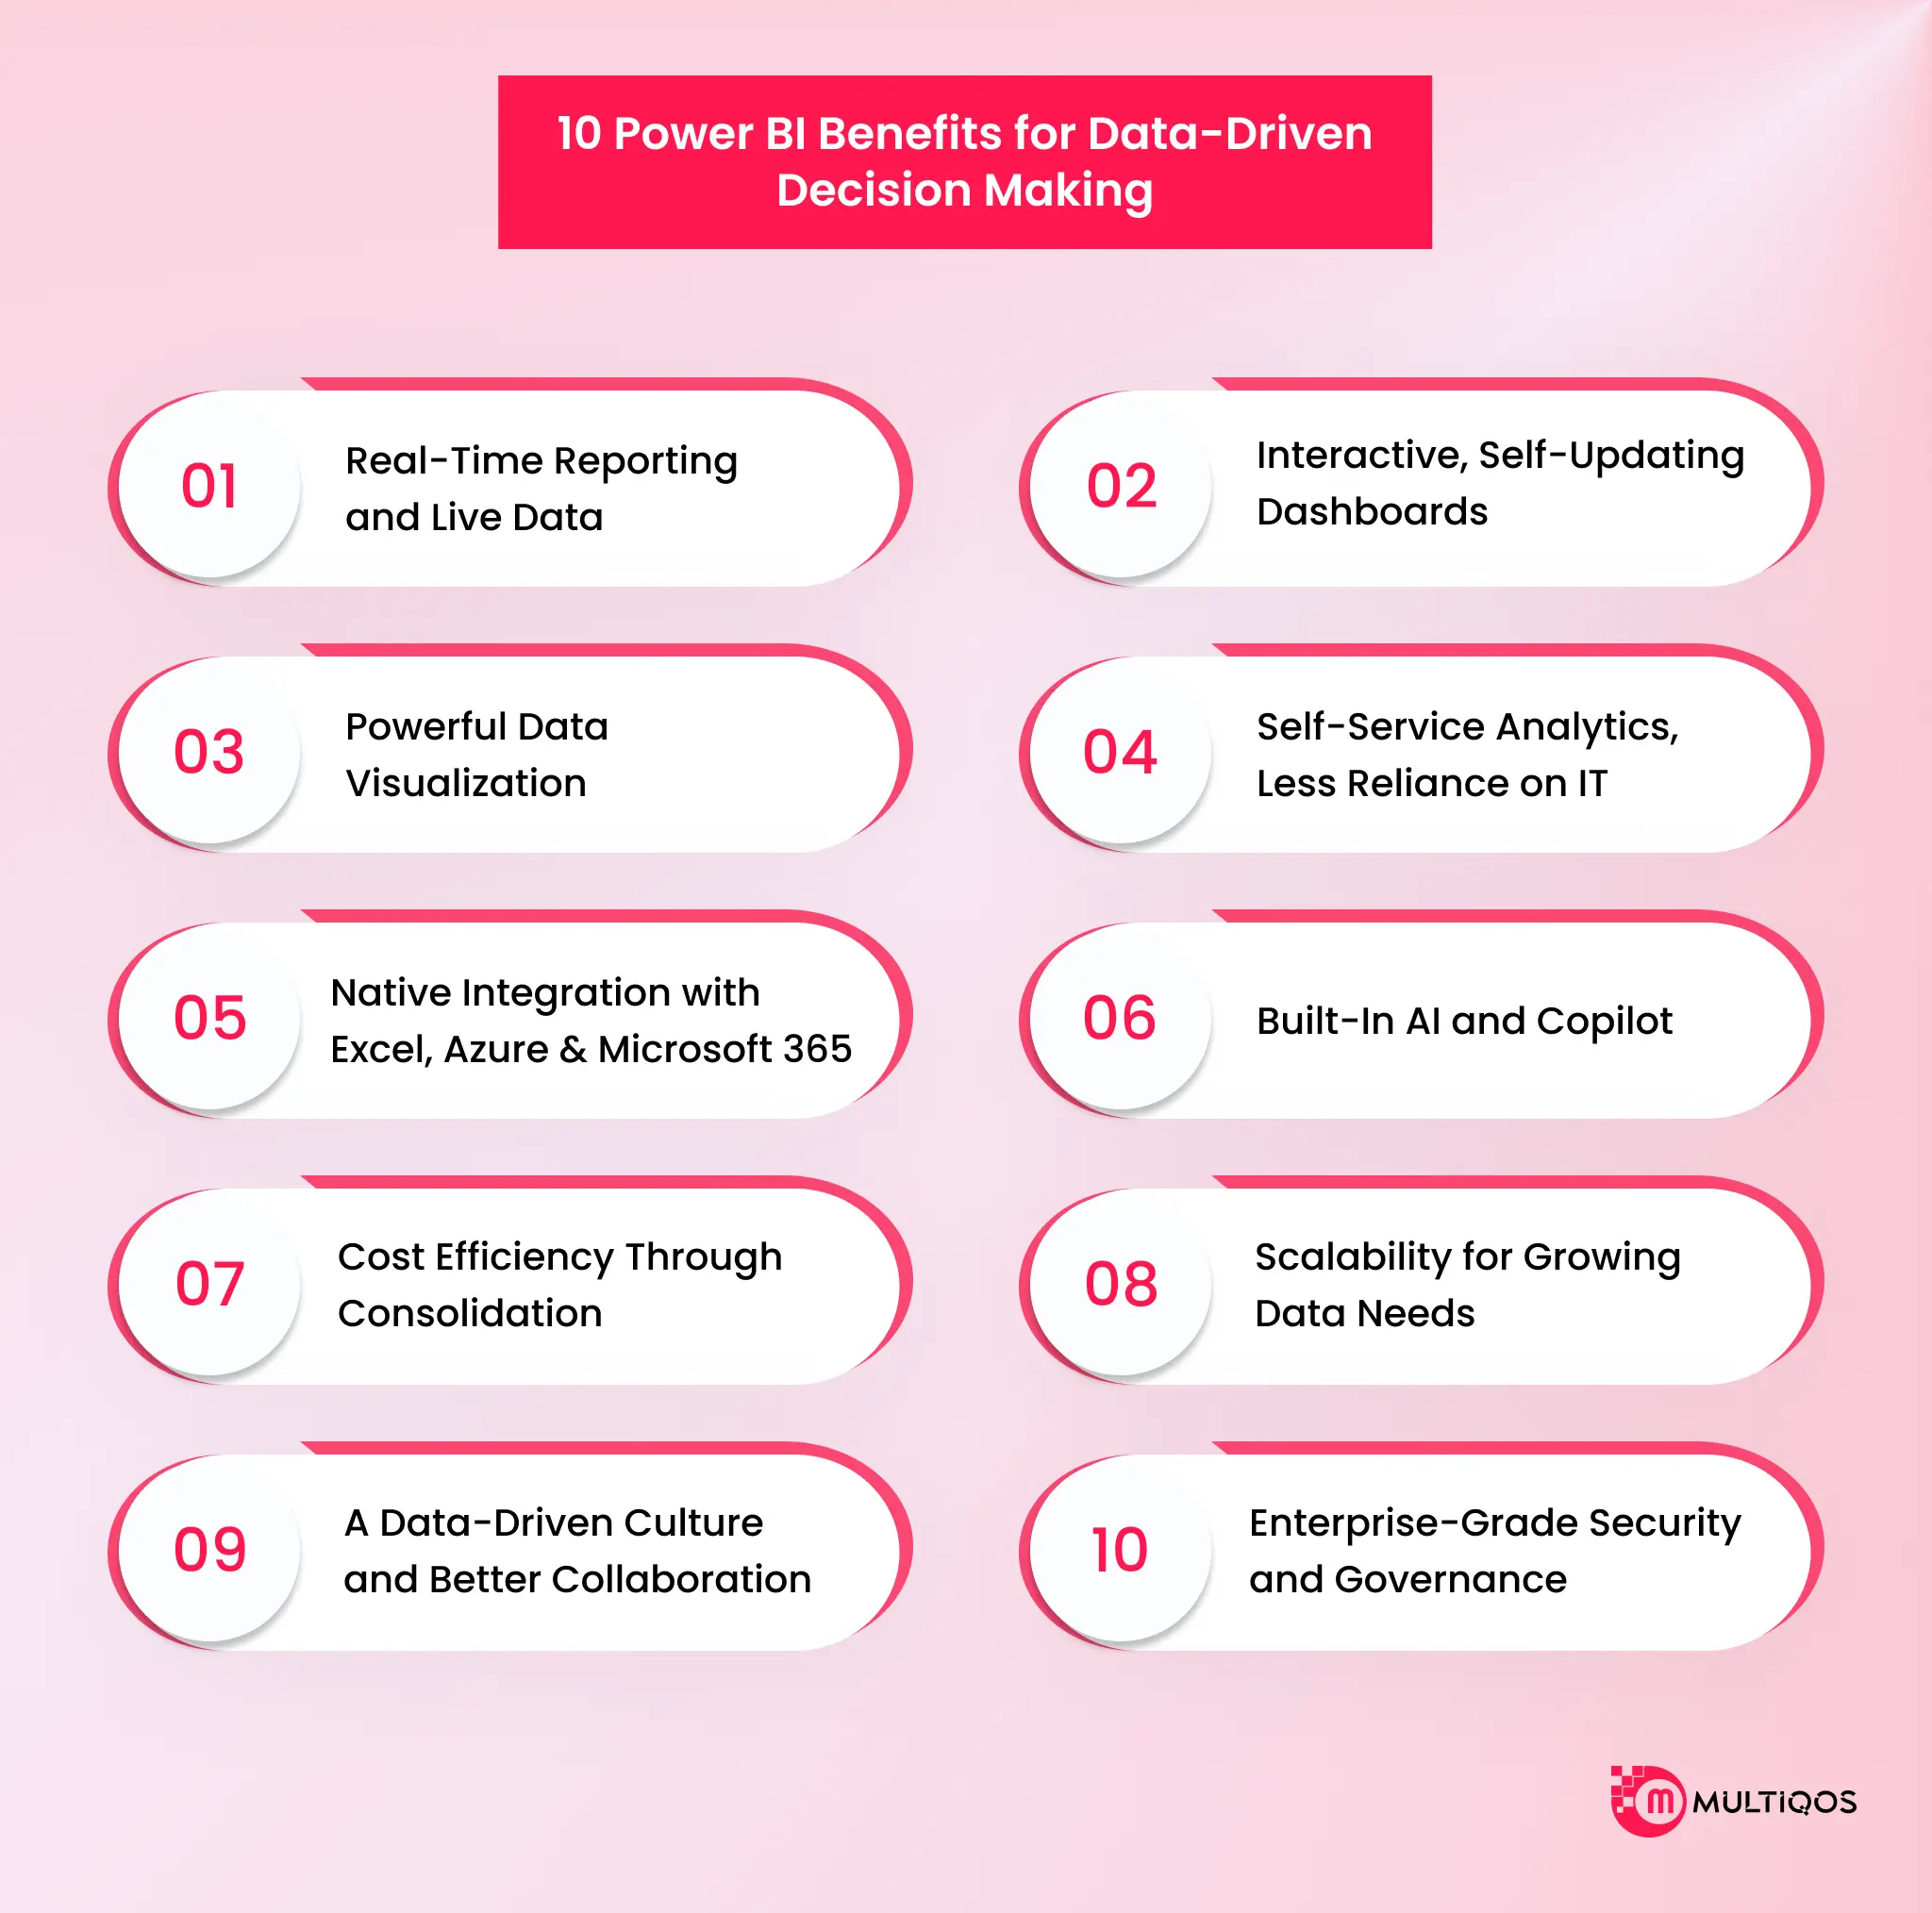
Here are some of the top Power BI benefits for your business to ensure data-driven operations and improved ROI.
1. Real-Time Reporting and Live Data
Most dashboards show you yesterday. Power BI shows you now. It connects to streaming sources like Azure Stream Analytics and Web APIs, so logistics and healthcare teams watch inventory move or patient flow shift while they can still act on it. For heavy datasets, Direct Lake mode reads straight from the data lake and returns answers without waiting on a refresh cycle.
2. Interactive, Self-Updating Dashboards
Static reports die the moment you publish them. Dynamic dashboards don’t. They sync automatically across sources and refresh on a schedule, so nobody presents stale numbers in a Monday review. Streaming tiles handle live feeds like IoT sensor telemetry, updating smoothly as packets arrive.
3. Powerful Data Visualization
Microsoft Power BI creates heat maps, flow charts, and graphs from millions of data points to reveal what is hidden within a spreadsheet. The AppSource provides hundreds of visualizations, and if a particular visualization fails to show the correlation, then a new one that reveals it is selected.
4. Self-Service Analytics, Less Reliance on IT
The bottleneck in most companies isn’t data. It’s the queue to reach it. Microsoft Power BI’s governed self-service framework lets non-technical staff query pre-authenticated models safely, without a ticket and without great technical skill. Remove IT as the gatekeeper, and decisions that used to wait weeks close in an afternoon.
5. Native Integration with Excel, Azure, and Microsoft 365
It doesn’t sit beside your Microsoft stack, but lives inside it. Users embed reports directly into Teams channels and SharePoint sites, and finance teams analyze live, secured cloud data from the Excel interface they already know. Authentication flows through Microsoft Entra ID, so Single Sign-On happens without a second login.
6. Built-In AI and Copilot
Microsoft Copilot is the part that changes who gets to do analysis. Ask “show total profit by region” in plain language, and it builds the visual for you. Smart narratives summarize what moved in the data week over week, and AI-assisted development writes the complex DAX formulas that used to gate analysts out.
7. Cost Efficiency Through Consolidation
The savings rarely come from doing more. They come from retiring what you no longer need. Companies collapse a stack of legacy vendor tools into one platform and stop paying for overlap they never audited. The return compounds further when Power BI runs on Microsoft Fabric rather than as a standalone install.
8. Scalability for Growing Data Needs
Microsoft Power BI scales from a solo analyst on the free Desktop version to a global enterprise on Microsoft Fabric Capacity. Inside a Fabric environment, it uses OneLake, a unified SaaS lake that holds every department’s data in one place. That kills the fragmented warehouse sprawl and stops performance from degrading as volume climbs.
9. A Data-Driven Culture and Better Collaboration
The root of conflicting numbers in different departments lies not in the bad calculations but in the difference in the definition of numbers. Microsoft Power BI provides a unified semantic model that guarantees the consistent use of metrics across the departments. Teams can collaborate, comment on, and view the data from mobile devices or a shared workspace, turning reporting from a transfer process into communication.
10. Enterprise-Grade Security and Governance
Security needs to follow the data, not stay only in reports. One of the crucial Power BI benefits is the integration with Microsoft Purview Information Protection and applies a label “Highly Confidential”, for instance, to the data right from the source and then to the file wherever it goes. An exported file to Excel or PDF remains encrypted. The Row-Level Security (RLS) restricts what the user can see depending on the role.

The Business Impact of Power BI: What to Expect?
Power BI benefits are not limited to operational ROI. It shows a measurable reduction in productivity and time spent on manual reporting and a rise in the share of decisions backed by real-time data rather than static exports.
| Benefit | Business Outcome |
| Real-time reporting | Faster reaction to revenue or operational shifts, decisions made on current data instead of last month’s close |
| Self-service analytics | Central data team freed from routine ad-hoc requests, faster turnaround for business users |
| Excel and Azure integration | Lower training cost, faster adoption, no rip-and-replace of existing tools |
| Copilot and built-in AI | Non-technical users get answers without writing queries, faster time-to-insight |
| Enterprise security and governance | Reduced audit and compliance risk, faster legal sign-off for regulated industries |
| Strong ROI | Higher ROI |
How to Get Started: A Practical Roadmap to Gain More Power BI Benefits
Most Microsoft Power BI rollouts don’t fail because the tool can’t do the job. They fail because nobody scoped a pilot narrow enough to ship in weeks instead of quarters. So, here is a Microsoft Power BI implementation roadmap to ensure scope creep does not affect ROI.
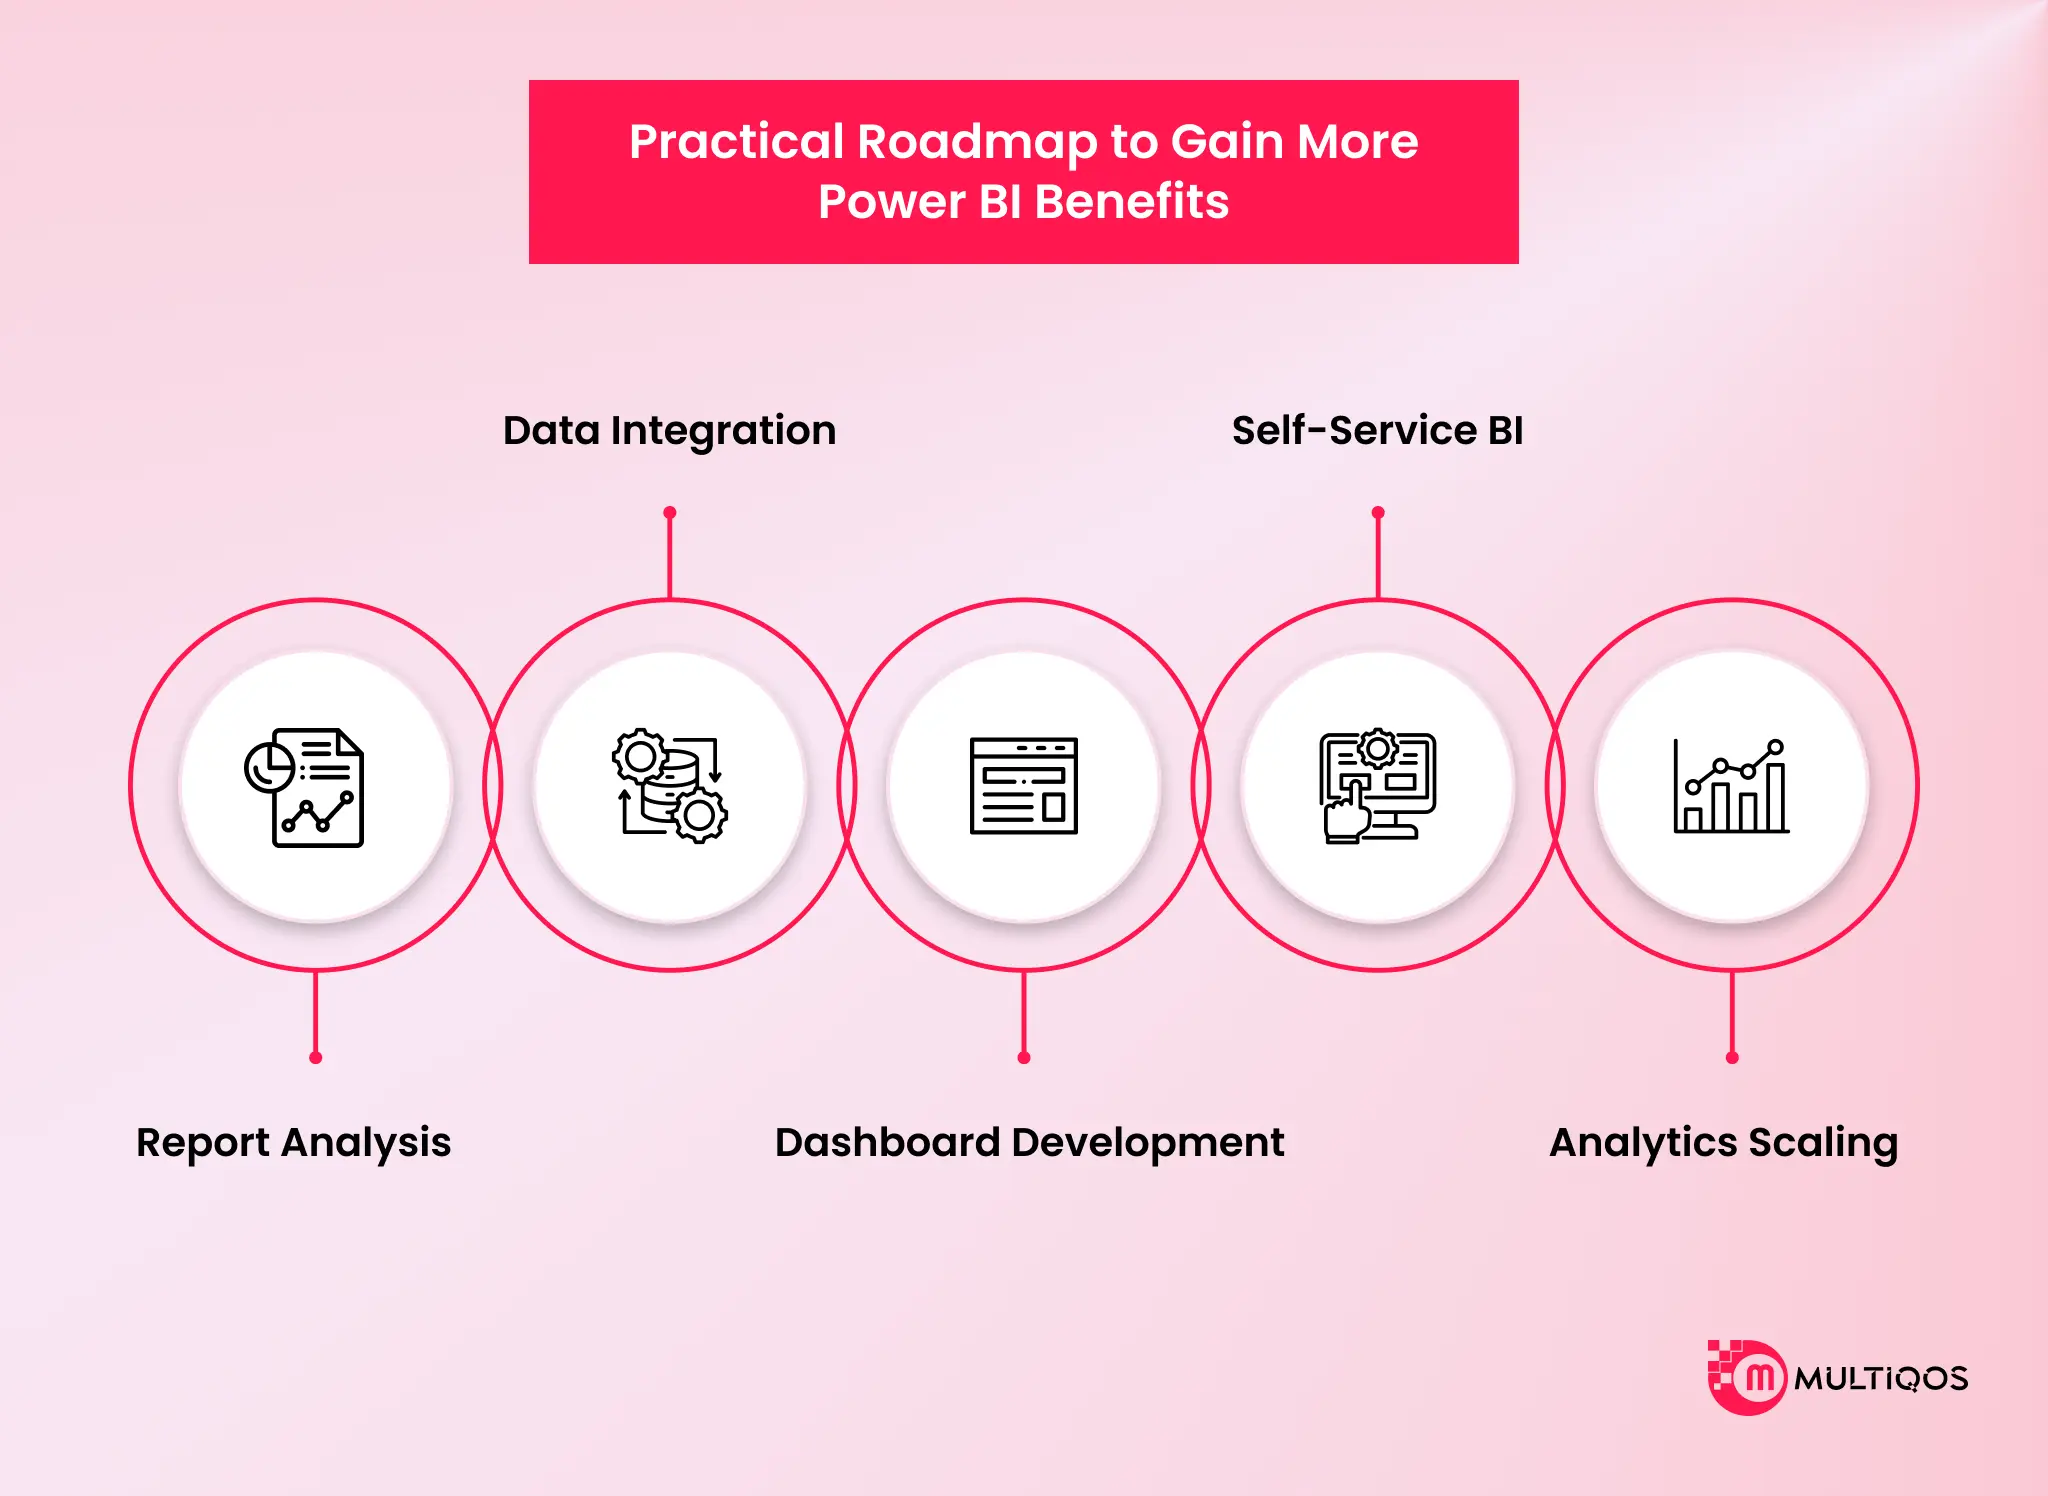
1. Find the One Report That’s Bleeding Hours
Don’t start with strategy. Start with the report someone rebuilds by hand in Excel every week. That manual grind is your best pilot, because the payoff is obvious the moment it disappears. Financial profitability breakdowns, sales trend tracking, and operational inventory monitoring are the usual candidates.
Pick the one where a person currently spends an afternoon assembling what a refreshed dashboard could show in seconds, and you’ve picked right.
2. Wire Up Your Core Data Sources First
The reliability of your dashboard depends entirely on the quality of your data sources. Power BI has native connectors to SQL databases, Excel, Salesforce, and Dynamics 365, among others, in the cloud, allowing you not to worry about creating a new pipeline yourself.
The financial department has a special connection with Power BI, conducting scratchpad analysis in a familiar Excel interface while keeping the underlying data in a governed lake. Direct Lake mode allows for working directly with that lake with quick responses without delays that prevented live reporting from becoming real in the past.
3. Ship One Dashboard to One Team
Organization-wide rollouts on day one don’t fail loudly. They fail quietly because nobody owns the feedback. So don’t attempt one. Hand a single dynamic dashboard to finance or ops and watch what they actually do with it.
Power BI turns raw data points into heat maps and flow diagrams that a non-analyst can read, and shared workspaces let that pilot team view, comment, and decide on the same screen instead of trading spreadsheet versions over email.
4. Open Self-Service, Then Fence It
Self-service without governance isn’t freedom. It’s chaos with a nicer interface. Once the pilot proves out, give non-technical staff a governed way to query pre-authenticated models on their own, so they stop queuing for every answer. Then set the guardrails.
Row-Level Security filters what each person sees by role, and Microsoft Purview sensitivity labels travel with the data. Export a report to Excel or PDF, and the label follows it, so the file stays encrypted after it leaves the dashboard.
5. Scale on Fabric or Azure, Not on Faith
Scaling from the departmental to the enterprise level is the stage when many BI deployments become financially inefficient in terms of overpaying. The higher license tier in the Fabric is usually less expensive since it enables viewers to access content for free rather than buy a per-seat license.
On a technical level, OneLake is one SaaS lake for all the company’s data, thus removing the need for departmental data lakes, which cause conflicting numbers in the first place. With the proper scaling, it will give a unified version of the truth, leaving no room for arguing during high-stakes meetings.

Conclusion
The advantage was never about owning more data. Every competitor has data. The advantage is acting on it faster than the company across the street. Power BI’s real-time refresh, self-service model, and built-in AI exist to close the gap between when something happens and when someone with the authority to act on it actually sees it.
Real-time data beats stale data, self-service beats bottlenecked IT, and a higher ROI is hard for a board to argue with. Static reporting told you what happened last month. Power BI tells you what’s happening now, and increasingly, what’s about to happen next.
Power BI is a business intelligence product from Microsoft for connecting, reporting, and sharing live dashboards. It aids a business by eliminating static, manually updated spreadsheets and tools that present data in dashboards that update automatically and remain connected to the source system, thus ensuring that decisions are made on the current numbers, rather than the numbers exported last month.
The key benefits include real-time reporting, self-service analytics, native Excel and Microsoft 365 integration, enterprise-grade security, built-in AI with Copilot, and good ROI. They move the reporting from being IT-dependent and monthly to being live and self-serve for most of the business users.
Microsoft found that a composite organization can generate a payback in less than six months with an ROI of 124% when leveraging the Power Platform, including Power BI. A company’s actual ROI will depend on its adoption speed of self-service.
Retailers use Power BI to merge POS, inventory, and online sales data into a single dashboard. Store managers see stock-outs before they hurt sales; the marketing team tracks campaign ROI against actual purchase data live, no waiting on end-of-month CSV pull. Chains running 50+ stores use it to spot underperforming locations the same day, not the same quarter.
Retailers use Power BI to merge POS, inventory, and online sales data into a single dashboard. Store managers see stock-outs before they hurt sales; the marketing team tracks campaign ROI against actual purchase data live, no waiting on end-of-month CSV pull. Chains running 50+ stores use it to spot underperforming locations the same day, not the same quarter.
Hospitals connect EHR, billing, and staffing systems through Power BI to watch patient flow, bed occupancy, and readmission rates on a live dashboard. Admins catch capacity crunch before ER backs up, and compliance teams pull audit-ready reports without manual reconciliation across departments. HIPAA-compliant row-level security keeps sensitive data restricted by role: doctors see clinical, finance sees billing, nobody sees both without clearance.

Get In Touch

Get Stories in Your Inbox Thrice a Month.
Microsoft IQ Explained: The Role of Fabric IQ, Foundry IQ, Work IQ, and Web IQ
Building Automated Approval Workflows with Microsoft Power Automate
Paper Checklists to Power Apps for Manufacturing: Digitizing Shop-Floor Workflows