
Microsoft Power BI vs Databricks AI/BI: When to Use Each (and When to Use Both)
Need quick insights? Summarize with AI & save time
 ChatGPT
 Perplexity
 Claude
 Google AI Mode
Table of Content
- What is Microsoft Power BI built to do?
- What is Databricks AI/BI built to do?
- Where does each tool sit in the analytics stack?
- Microsoft Power BI vs Databricks AI/BI: a side-by-side comparison
- What Power BI and Databricks AI/BI actually cost in 2026
- A 5-step Framework for Deciding Between Microsoft Power BI vs Databricks AI/BI
- Microsoft Power BI and Databricks AI/BI: When to Use What?
- What to Choose Between Microsoft Power BI vs Databricks AI/BI?
- FAQs
Summary:
Microsoft Power BI and Databricks AI/BI get compared as competitors. They aren’t. Power BI is a distribution layer priced by audience. Databricks AI/BI is an analysis layer priced by consumption. This guide breaks down three reference architectures, August 2026 pricing on both platforms, and a five-step framework for deciding where the boundary sits, including when running both is the correct answer.
221 zettabytes is what global internet users will generate by the end of 2026. As an enterprise, you need to deal with customer data as well as the internal data generated by teams. Microsoft Power BI is widely used for data reporting, business KPI tracking, and creation of self-service dashboards. Most enterprises reach that point through some form of Microsoft Power BI consulting, because the dashboards are the easy part and the governance underneath is not.
However, 67% of business leaders do not fully trust the data behind their pricing decisions. This is where the difference between Microsoft Power BI vs Databricks AI/BI becomes crucial. Microsoft Power BI does offer several capabilities for business intelligence. Similarly, Databricks AI/BI dashboards are also low-code AI-assisted reporting tools featuring interactive visualization and Genie or conversational interfaces.
So, should you replace Microsoft Power BI with Databricks AI/BI?
The short answer is no. Databricks is not replacing Power BI. The two are not substitutes either, because Power BI is a distribution layer priced by audience while Databricks AI/BI is an analysis layer priced by consumption. Run a lakehouse, and you probably run both; most enterprises do. Where the boundary sits is the only question.
And this piece answers it all, including what is Microsoft Power BI built to do, what is Databricks AI/BI and what’s the difference between them.
What is Microsoft Power BI built to do?
Power BI optimizes for one thing above all others: governed distribution to a large, non-technical audience.
Power BI Desktop, Power BI Service, and Microsoft Fabric: how the three fit together
Three surfaces, one artifact. The semantic model, typically a .pbix, is authored in Desktop on the VertiPaq in-memory engine. Publishing, workspaces, subscriptions, and row-level security all sit with the Service. Underneath both, Microsoft Fabric supplies capacity and storage, unifying Power BI, Synapse, and Data Factory on OneLake and licensed by F-SKU capacity.
Direct Lake queries Delta Parquet in OneLake with no import step. It is also Fabric-exclusive, which is why licensing and architecture end up being a single conversation rather than two. That single conversation is why Microsoft Fabric consulting tends to start with capacity sizing rather than report design.
Where does Power BI start to strain?
Isolation is the structural problem: the semantic model is a single artifact, and changing one measure means republishing the whole file. That makes drift a design consequence rather than a defect. Exposure grows roughly linearly with workspace count. None of this cancels what the platform does well; the benefits of Power BI for data-driven businesses still hold. It just means the strain shows up structurally, not gradually.
What is Databricks AI/BI built to do?
Calling Databricks AI/BI a Power BI clone with a chat box misreads it. Analysis runs where the data already sits, with no extract. Getting that right depends on how the lakehouse underneath was built, which is where Azure Databricks services do most of the quiet work.
AI/BI Dashboards and AI/BI Genie do two different jobs
Dashboards answer fixed questions. Genie answers ad-hoc ones, a different job entirely, and conflating the two remains the most common error in these evaluations.
Low-code authoring is what AI/BI Dashboards provide, for questions you already know you will ask, with cross-filtering and emailed PDF snapshots. They run on Photon against Pro or Serverless SQL warehouses. Genie takes the questions nobody anticipated, and it asks for clarification when a request is ambiguous.
No separate license attaches to Dashboards. What you pay for is the SQL warehouse compute they query, and that is not the same sentence as free.
Genie One, Genie Ontology and Genie Agents: what actually changed in 2026
Three capabilities landed inside eight months, and the naming churn hid all of them.
- Databricks One became Genie on 27 April 2026
- Genie became Genie One on 9 June 2026
- Genie Spaces became Genie Agents on 9 July 2026
- Genie One was introduced on 20 January 2026, bringing iOS and Android apps, native Slack and Teams integration, and search across structured and unstructured data.
- Genie Ontology reached Public Preview in June 2026. It auto-extracts context from dashboards, pipelines, and 50+ external tools, then applies OntoRank to weight those sources by creator authority.
- Genie Agents act autonomously. They work through Model Context Protocol over unstructured data in Unity Catalog volumes.
Scoping on the Knowledge Store is per agent, so it never touches global Unity Catalog metadata. Instructions are plain-text business rules, capped at 40,000 characters.
How accurate is Genie in practice?
84.5% first-attempt accuracy, measured on Databricks’ own 28-question benchmark. General-purpose coding agents scored 52.4%, the weakest 25%, while Snowflake reported roughly 80% for Cortex Sense. A 28-question internal suite gives you a directional signal, not an independent evaluation.
Where does each tool sit in the analytics stack?
Power BI and Databricks AI/BI occupy different layers of the analytics stack. Most arguments about which one is better turn out to be disagreements about which layer the argument is actually about.
Databricks’ center of gravity spans storage, compute, and the semantic layer, then reaches upward into serving. Building this architecture effectively requires reliable ingestion, transformation, orchestration, and governance across the data stack. This is where data engineering services become essential for creating scalable pipelines and analytics-ready data.
Architecture 1: Power BI-led, Fabric at the center
Put Fabric at the center, and Databricks becomes an upstream source. The definition lives in the .pbix. Unity Catalog tables surface as mirrored catalogs: metadata-only shortcuts on a 15-minute sync. Framing in Direct Lake is a metadata refresh rather than a data load, so it completes in seconds no matter how large the table.
Auth runs on OAuth 2.0 with Entra ID passthrough SSO, or on service principals. Partner Connect handles the setup.
| Layer | Contents |
|---|---|
| Layer 1 Sources | Operational databases, SaaS apps, files |
| Layer 2 Lakehouse | Databricks Bronze- Silver – Gold, Unity Catalog governs |
| Layer 3 Mirrored cat. | UC tables in Fabric, metadata-only, 15-minute sync |
| Layer 4 OneLake | Delta Parquet, Fabric-native storage |
| Layer 5 Semantic | Power BI model (.pbix) on VertiPaq [DEFINITION HERE] |
| Layer 6 Serving | Power BI Service: workspaces, RLS, paginated reports |
| Layer 7 Consumption | Excel, Teams, mobile, email PDF |
Takeaway: Databricks sits upstream, the .pbix holds the definition, and drift risk scales with workspace count. If OneLake, Direct Lake, and F-SKU capacity are new terms in your estate, our Microsoft Fabric overview unpacks how the pieces sit together before the licensing conversation starts.
Architecture 2: Databricks-led, BI on the lakehouse
Move the lakehouse to the center and the semantic layer relocates into Unity Catalog metric views. Power BI becomes one consumer among several.
Metric views are a centralized YAML layer that separates measures from dimensions, so a metric holds at any grain: GA April 2026, DBR 16.4+ on Pro or Serverless SQL, and no 1-to-many joins as of December 2025. RLS, masking, and ABAC are enforced by Unity Catalog at the data layer.
This is inherited by every downstream tool, with lineage running from pipeline to widget. Enforcement at the data layer is also the pattern that holds up under audit, something we cover in more depth on AI governance for enterprise LLMs.
| Layer | Contents |
|---|---|
| Layer 1 Sources | Operational databases, SaaS apps, files |
| Layer 2 Lakehouse | Databricks Bronze- Silver – Gold on Delta |
| Layer 3 Governance | Unity Catalog: RLS, masking, ABAC, lineage to widget |
| Layer 4 Semantic | UC metric views (YAML) [DEFINITION HERE] |
| Layer 5 Compute | Databricks SQL warehouse, Photon; no extract |
| Layer 6 Serving | AI/BI Dashboards (fixed) · Genie Agents (ad-hoc) |
| Layer 7 Consumption | browser, Slack, Teams, mobile, MCP actions |
Takeaway: One definition, enforced at the data layer and inherited by every downstream tool, Power BI included.
Architecture 3: coexistence, split by question type
Three patterns are documented in this type of architecture:
- An engineering and consumption split with Gold mirrored to Fabric
- Segmented coexistence, where Power BI keeps board scorecards and regulatory reporting while ad-hoc questions route to Genie Databricks Apps in React or Python
- Capacity optimization, which moves exploratory load to Databricks SQL and downsizes the Fabric SKU.
| Layer | Contents |
|---|---|
| Layer 1 Sources | operational databases, SaaS apps, files |
| Layer 2 Lakehouse | Bronze- Silver – Gold |
| Layer 3 Unity Catalog | governance + metric views = the definition boundary |
| Split at the serving layer | |
| Path A Recurring and regulated | Gold – Fabric- Power BI model- paginated reports, board scorecards |
| Path B Ad-hoc and explanatory | Databricks SQL warehouse- Genie Agents- Slack |
Takeaway: Split by question type, not by team, and let the metric-ownership contract hold the two paths together.
Microsoft Power BI vs Databricks AI/BI: a side-by-side comparison
Here is a comprehensive breakdown between Microsoft Power BI vs Databricks AI/BI
| Microsoft Power BI (with Fabric) | Databricks AI/BI | |
|---|---|---|
| Primary purpose | Governed distribution of fixed, repeatable reports to a broad audience. | Ad-hoc questions and low-code dashboards on lakehouse compute, where the data already lives. |
| Semantic layer | In the .pbix on VertiPaq; changes require republishing the file. | Unity Catalog metric views: YAML, GA April 2026, DBR 16.4+ on Pro or Serverless SQL. Knowledge Store is per-agent context only. |
| Natural language | Copilot for Power BI. Requires F64+ or Premium: a licensing floor, not a toggle. | Genie One and Genie Agents. Slack, Teams, mobile, Inspect Mode over generated SQL. |
| Authoring control | Custom visuals, bookmarks, themes, precise layout. Mature. | Low-code with cross-filtering. No custom-visual ecosystem. |
| Scheduled output | Paginated reports (now Azure Maps), subscriptions, scheduled delivery. | Emailed PDF snapshots. Gartner flagged operational and pixel-perfect reporting as less mature at the 2026 MQ debut. |
| Governance | RLS and OLS per model, duplicated unless you run DirectQuery with Entra ID SSO. Purview extends labels across M365. | Unity Catalog enforces RLS, masking, and ABAC at the data layer, inherited downstream. Lineage: pipeline to widget. |
| Best-fit user | Report consumers and BI developers in the Microsoft estate. | Analysts in the lakehouse asking unanticipated questions. |
| Data-science proximity | Separate stack; notebooks and ML live elsewhere in Fabric. | Same platform as pipelines and ML. Agents act via MCP over UC volumes. |
What Power BI and Databricks AI/BI actually cost in 2026
Comparability between Microsoft Power BI vs Databricks AI/BI arrives only after you convert both to a per-month figure at your own audience size, on August 2026 list prices.
Power BI and Fabric: everything turns on the F64 threshold
The cheap SKU is the expensive one. Below F64, you pay twice: for capacity, and for a Pro license attached to every viewer.
- Pro lists at $14.00 per user per month on annual billing, and it buys 1 GB model memory, 8 refreshes daily, and 10 GB storage.
- At $24.00 per user per month, PPU brings 100 GB model memory and 48 refreshes daily; the step-up from Pro or M365 E5 costs $14.
- Consumers view content without a paid per-user license only at F64+ or P1+. Publishers need Pro at every SKU.
- Capacity itself lists near $262.80/mo PAYG for F2, $8,409.60 for F64, and $5,002.87 for F64 reserved one year, roughly a 40.5% to 41% discount.
Databricks: consumption billing, two bills, and the July 2026 Genie change
On 8 July 2026, Genie Code moved to pay-as-you-go. Genie One and Genie Agents stayed free only through 31 July 2026. So, Databricks bills DBUs (Databricks Units). Your cloud provider bills the infrastructure separately, which is why teams budgeting DBUs alone understate total spend.
In Databricks, SQL Classic runs about $0.22 per DBU, SQL Pro about $0.55, and Serverless about $0.70 in the US against $0.91 in the EU. Idle warehouses keep burning DBUs until auto-stop fires. Genie includes 150 free DBUs per named user per month. Roughly $10.50 in US East. The allowance covers Genie LLM usage and nothing else, so Genie compute such as SQL Serverless bills separately on top of it.
So, with Databricks, consumption scales with query volume multiplied by warehouse uptime, not headcount, which means one user asking 100 questions costs roughly what 100 users asking one question. Consumption wins on large but infrequent audiences.
Where the numbers land is estate-specific, and an IT consulting review usually settles it faster than a spreadsheet built from list prices alone. Now that you know the cost and differences, which one must you choose, or how to leverage both for your enterprise? The answer is a 5-step framework.
A 5-step Framework for Deciding Between Microsoft Power BI vs Databricks AI/BI
Here is a step-by-step framework you can use as a CFO to decide which is the best data stack strategy.
| Step | What you do | Deliverable |
|---|---|---|
| 1. Size the audience by cadence | Count everyone who will open a report. Split into daily viewers, monthly viewers, and publishers. Publishers need Pro at every SKU. | Licensing baseline: three headcounts, plus per-month figures for Pro, F64 PAYG, F64 reserved. |
| 2. Classify by question type | Tag every report fixed-and-recurring or ad-hoc-and-exploratory. Flag the regulatory and pixel-perfect subset; it is not portable. | Tagged inventory: fixed, exploratory, non-portable regulatory. |
| 3. Model consumption, not licenses | Forecast Databricks as users × sessions × $1.20 per ten-minute session, plus idle time, the separate cloud bill, and Fabric overage at 3x PAYG. | 12-month cost model: both Databricks bills, both Fabric lines, overage priced. |
| 4. Locate the semantic layer, name owners | Decide which metrics live in metric views and which stay as DAX. Assign a named owner per certified metric before anyone builds. | Signed ownership matrix, plus written reconciliation and escalation rules. |
| 5. Run a bounded pilot with a written exit criterion | Build one Genie Agent inside the 30-table ceiling and the same report in Power BI. Measure accuracy, cost per session, and time-to-answer against a preset threshold. | Pilot report: three numbers against a pre-written threshold, and a go/no-go decision. |
Microsoft Power BI and Databricks AI/BI: When to Use What?
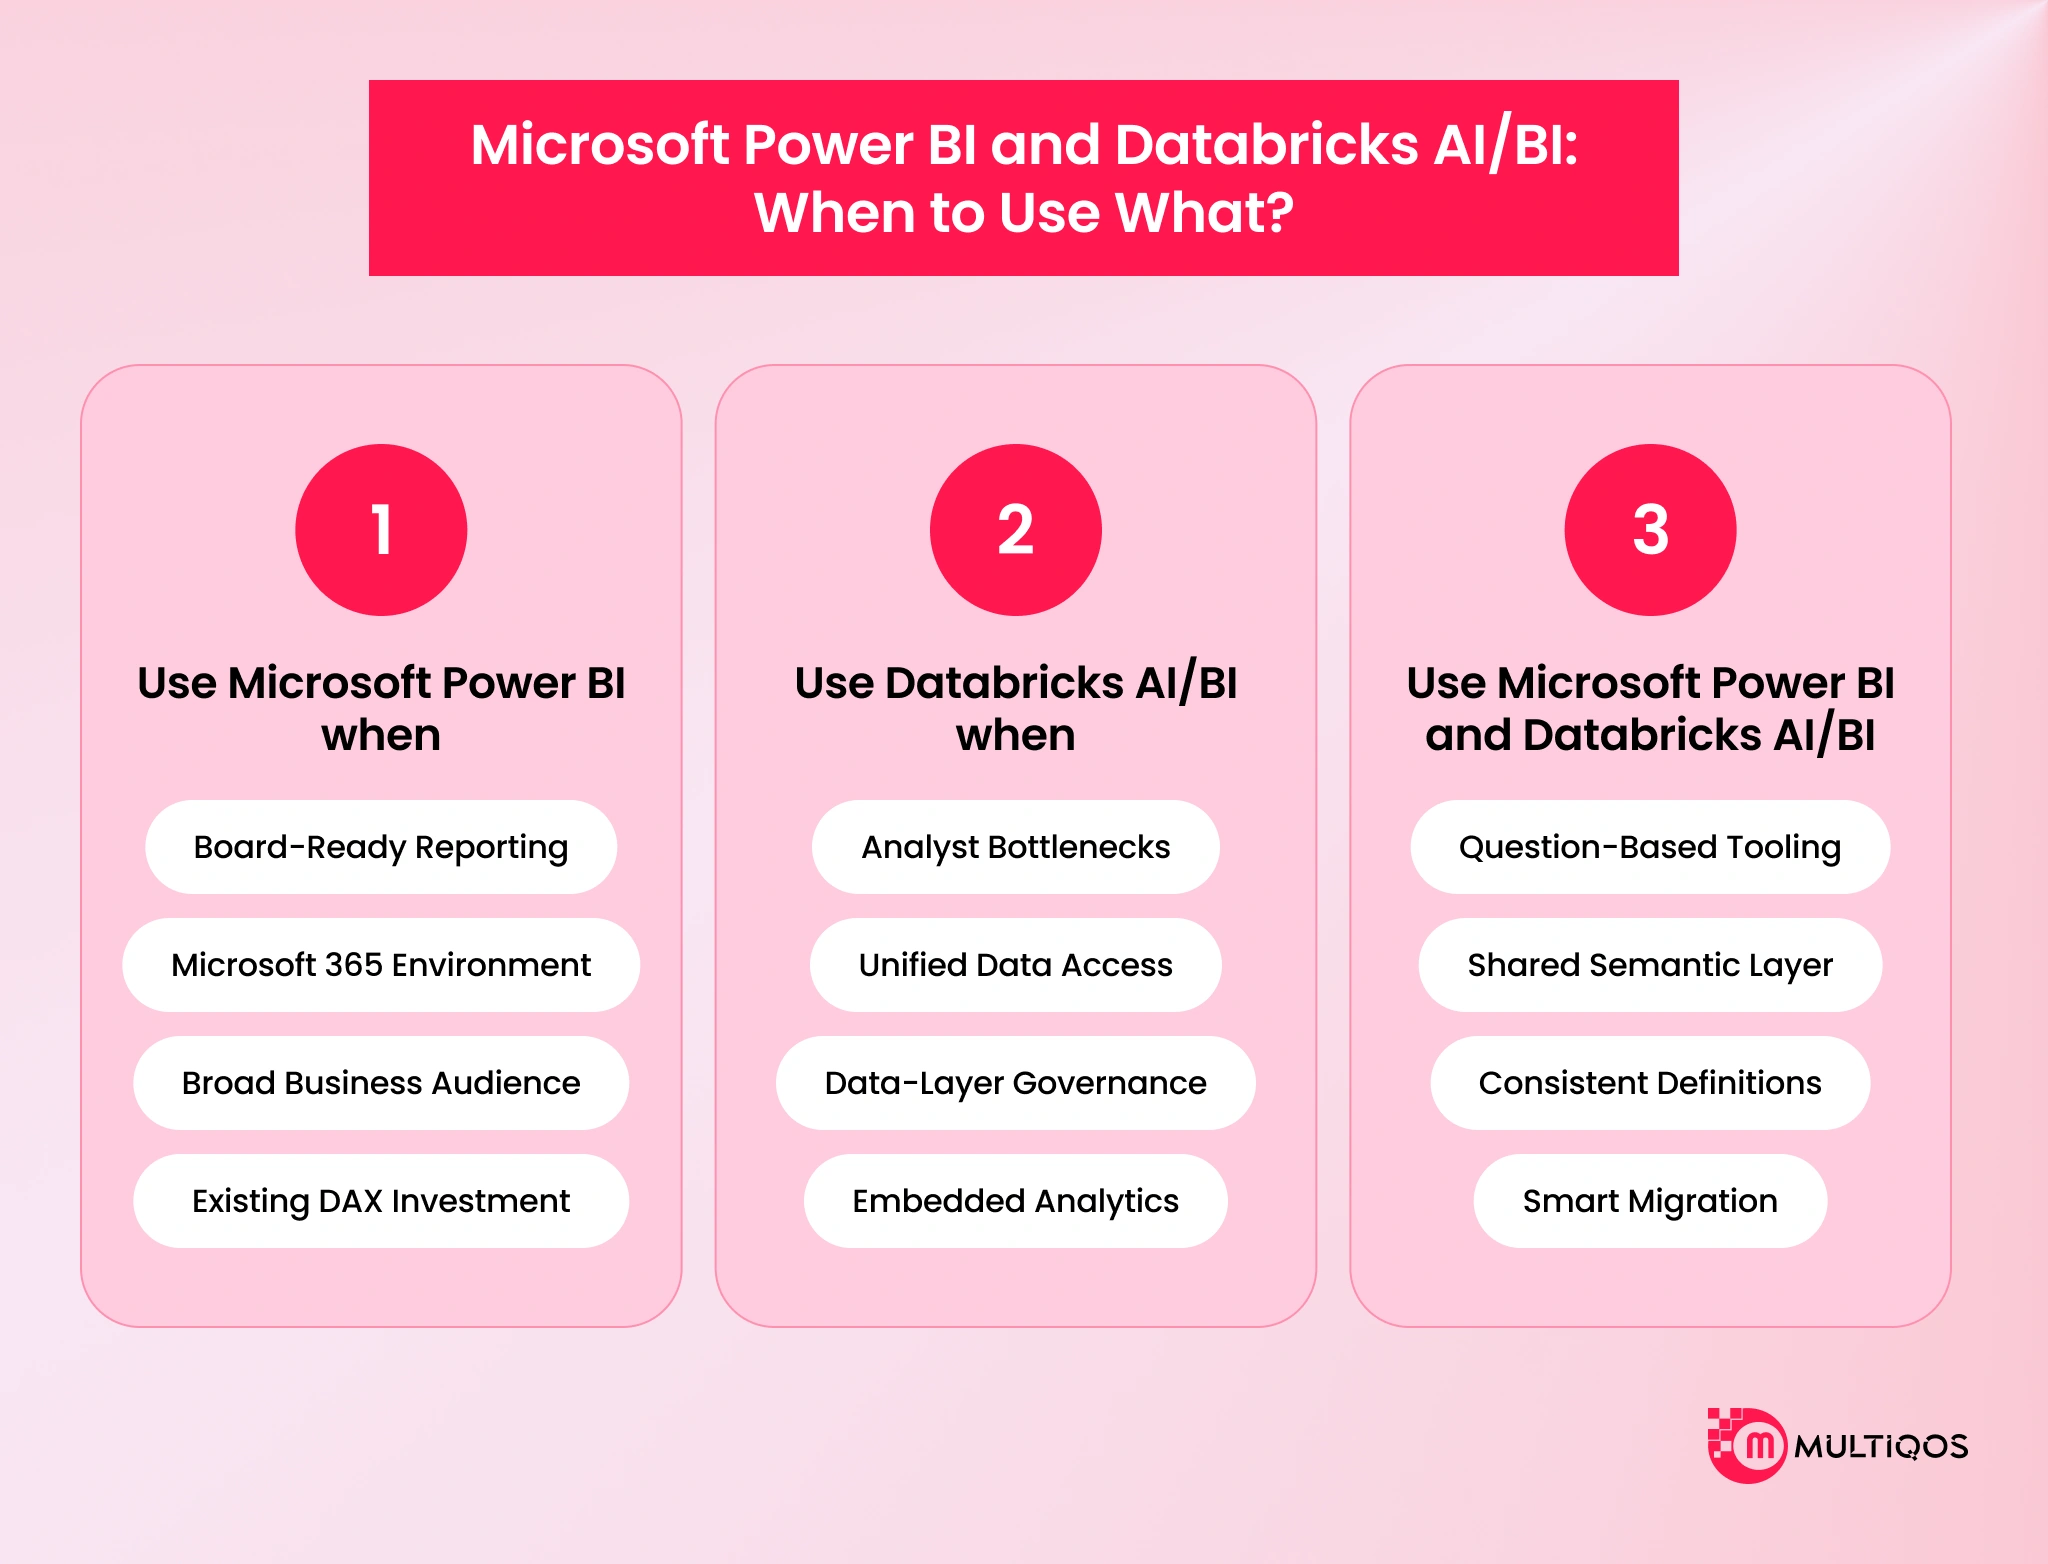
Most enterprises running a lakehouse alongside a reporting obligation will use both. Saying the platforms complement each other is not an answer, because it tells nobody which workload goes where.
Use Microsoft Power BI when
- The output is regulated or goes to the board. Paginated delivery is the deciding capability. An auditor, a regulator, or a board pack needs a document that renders identically every time, paginates predictably, and arrives on schedule without anyone opening a portal. An emailed snapshot is not that artifact, and no reviewer will accept it as one.
- Your organization already runs on Microsoft 365. Gravity is real and expensive to fight. Where finance already works in Excel, where approvals already happen in Teams, and where identity already runs on Entra ID, the distribution problem is largely solved before the project starts.
- The audience is wide and reads more than it explores. Capacity licensing rewards a large population that consumes rather than investigates. A workforce opening one dashboard each Monday morning is precisely the shape capacity pricing was designed around, and precisely the shape consumption pricing handles worst.
- The estate carries heavy existing DAX investment. Sunk cost is a poor argument. Replacement cost is a strong one. The calculations that took longest to build are usually the ones least likely to migrate cleanly, so count them individually before anyone prices the move.
Use Databricks AI/BI when
- The analyst queue is the bottleneck. Every enterprise runs the same queue. A question arrives, an analyst writes SQL, the answer returns days later, and by then the question has moved. For exploratory work, a fast answer that needs light verification beats a perfect answer arriving after the decision.
- Data science and BI read the same tables. Separation is the problem being solved. Where the analytics team queries one copy of revenue and the modeling team trains on another, the two will diverge, and nobody notices until something is already in production. Analysis running against the same governed tables removes the second copy entirely.
- Governance must be enforced at the data layer. Policy defined once and inherited downstream is structurally safer than policy defined per model and reconciled afterward. If your compliance posture requires a single enforcement point with lineage you can trace end to end, that belongs beneath the reporting tools rather than inside each one.
- Analytics belongs in Slack or Teams, not a portal. Portals lose to the places people already work. Questions get asked in the thread where the decision is being made, so the answer should surface in that thread rather than three clicks away.
Use Microsoft Power BI and Databricks AI/BI
- Split on question type, not on team. Recurring, formatted, and regulated output routes to Power BI. Unanticipated and exploratory questions route to Genie. A team-based boundary fails within a quarter, because every team has both kinds of questions and will cross the line the first time it needs the other thing.
- Keep one governed semantic layer and two serving surfaces. The definition lives in one place. The serving surfaces are allowed to be plural. Certified metrics carry a named owner, and the reporting layer consumes those definitions rather than reimplementing them.
- Design against duplicate definitions from the start. Two certified dashboards disagree about revenue an hour before the board meeting. Reconcile on a schedule, set the tolerance at zero rather than at rounding, and treat any difference as a defect with an owner attached.
- Expect migration to carry structure, not the hard work. Automated import moves schema and relationships across. Custom visuals, intricate bookmarks, and unusual fiscal calendars remain a manual rebuild you end up funding twice.
What to Choose Between Microsoft Power BI vs Databricks AI/BI?
The answer is to choose both, especially for most enterprises with a lakehouse. Because for such enterprises, choosing is not where the data stack decision sits. Two things decide it. The question-type boundary comes first.
Recurring and regulated reporting on one path, exploratory analysis on the other, and no team-based split anywhere in it. Second is the metric-ownership contract. One owned definition per certified metric is the only thing standing between you and two certified dashboards that disagree.
FAQs
Yes, natively, through the Azure Databricks connector or Partner Connect. Authentication runs on OAuth 2.0 for Entra ID passthrough SSO, with service principals covering automated publishing. Expect DirectQuery median latency near 724,000 µs against 174,000 µs for Import. Narrow the query window when reports drag.
Genie is a standalone conversational analysis surface over the lakehouse. Copilot is an assistant living inside Power BI, and it carries a hard licensing floor: F64 or higher, or Power BI Premium. GA for Genie One landed on 20 January 2026, with native Slack and Teams integration.
Neither. The two bill on different axes. Resolution comes only at your audience size. Power BI capacity breaks even against per-user Pro near 601 seats on F64 PAYG, or 358 reserved. Databricks scales on query volume times uptime, which is why a small team running constant sessions can outspend a large read-only audience.
Yes, with one caveat. It is credible for dashboards and ad-hoc analysis, and immature for operational and pixel-perfect reporting.
Yes, if you carry regulatory, paginated, or pixel-perfect distribution obligations. Automated migration from .pbix covers 55% of a Power BI estate, and custom visuals, complex bookmarks, and 4-4-5 calendar logic do not carry over. That leaves 45% as a manual rebuild you fund twice.
Not without deliberate scoping. A Genie Agent supports 30 tables or views; practitioners report most working deployments connecting fewer than 10, and one documented 5,000-table environment needed substantial preparation. A small, well-documented table set is what Genie assumes. Scope one domain per agent.

Get In Touch

Get Stories in Your Inbox Thrice a Month.
Microsoft IQ Explained: The Role of Fabric IQ, Foundry IQ, Work IQ, and Web IQ
Building Automated Approval Workflows with Microsoft Power Automate
Paper Checklists to Power Apps for Manufacturing: Digitizing Shop-Floor Workflows