
Microsoft Fabric vs Power BI: 8 Differences That Decide Your Platform Spend
Need quick insights? Summarize with AI & save time
 ChatGPT
 Perplexity
 Claude
 Google AI Mode
Table of Content
- Microsoft Fabric vs Power BI at a Glance
- Microsoft Fabric vs Power BI: 8 Key Differences That Matter for Your Data Strategy
- Which One Should You Choose: A Decision Framework
- Final Thoughts
- FAQs
Summary:
Power BI does not compete with Microsoft Fabric. It runs inside it, as one of seven workloads on a shared OneLake foundation, and that single distinction resolves most of the licensing confusion in the room. Most teams answer the platform question with a feature comparison and discover three months later the bottleneck was upstream, in pipeline sprawl Fabric was never bought to fix. This piece maps the two platforms side by side, then walks 8 traps that actually decide spend: nested licensing, Direct Lake refresh lag, ETL sprawl, per-seat ceilings, the F64 free-viewer line, tool-sprawl timelines, governance blast radius, and unaudited P SKU migration.
Microsoft is retiring the Power BI Premium per-capacity P SKUs and pushing everyone toward F SKUs before the next renewal cycle closes.
Microsoft Fabric is a unified analytics platform that houses data engineering, data warehousing, real-time analytics, and Power BI reporting on one storage layer called OneLake. If you have not mapped what Microsoft Fabric actually includes workload by workload, start there. Power BI doesn’t compete with it.
Power BI is a workload that runs inside it. That single sentence resolves more licensing confusion than most vendor decks manage in forty slides, and it is the sentence most Heads of Data are missing when the renewal conversation starts.
Here is the sequence error. A Director of Analytics at a 2,000-employee company gets asked in a Tuesday leadership review whether the org should “move to Fabric.” They answer based on feature comparisons pulled from a blog post, sign off on a capacity SKU sized by a vendor, and only discover three months later the actual bottleneck.
It was upstream, in a pipeline sprawl of five separate ETL tools, none of which Fabric was bought to fix. The capacity spend is already committed. The renewal is already signed.
So before the SKU conversation, you need the boundary, the cost arithmetic, and the failure modes that actually decide platform spend. This piece gives you both, plus a 90-day sequence for testing the answer instead of guessing it.
Microsoft Fabric vs Power BI at a Glance
| Dimension | Power BI | Microsoft Fabric |
|---|---|---|
| Scope | Reporting and semantic modeling only | Data engineering, warehousing, real-time analytics, data science, and reporting on one platform |
| Architecture and storage | Imported or DirectQuery datasets, proprietary storage | OneLake as the single lake for every workload, Delta Parquet as the native format |
| Primary users | Business analysts, report builders | Data engineers, data platform teams, and analysts, on the same shared data |
| Compute model | Fixed Premium capacity (P SKU) or per-user Pro license | Elastic F SKU capacity units, consumed across workloads and burstable or smoothed |
| Licensing model | Per-user (Pro, PPU) or per-capacity (Premium) | Pay-as-you-go or reserved capacity, priced by compute, not by seat |
| Entry cost | $14/user/month for Pro | F2 capacity starts far below Premium P1, scales up to F64 and beyond |
| Data engineering capability | None. Requires external ETL tools | Native: Data Factory pipelines, Synapse Data Warehouse, notebooks |
| Real-time capability | Limited, via DirectQuery or streaming datasets | Native Real-Time Intelligence workload for event and IoT data |
| Governance surface | Workspace-level, Power BI admin portal | Domains, OneLake data access roles, and full Microsoft Purview integration across every workload |
| Relationship to the other | Standalone product, or a workload inside Fabric | Superset. Power BI is one of seven workloads it hosts |
That table is not the decision. It is the map you need before you can locate where your actual constraint sits. The eight differences below walk through why the map matters, section by section, and each one closes with the dollar or hour figure attached to getting it wrong.

Microsoft Fabric vs Power BI: 8 Key Differences That Matter for Your Data Strategy
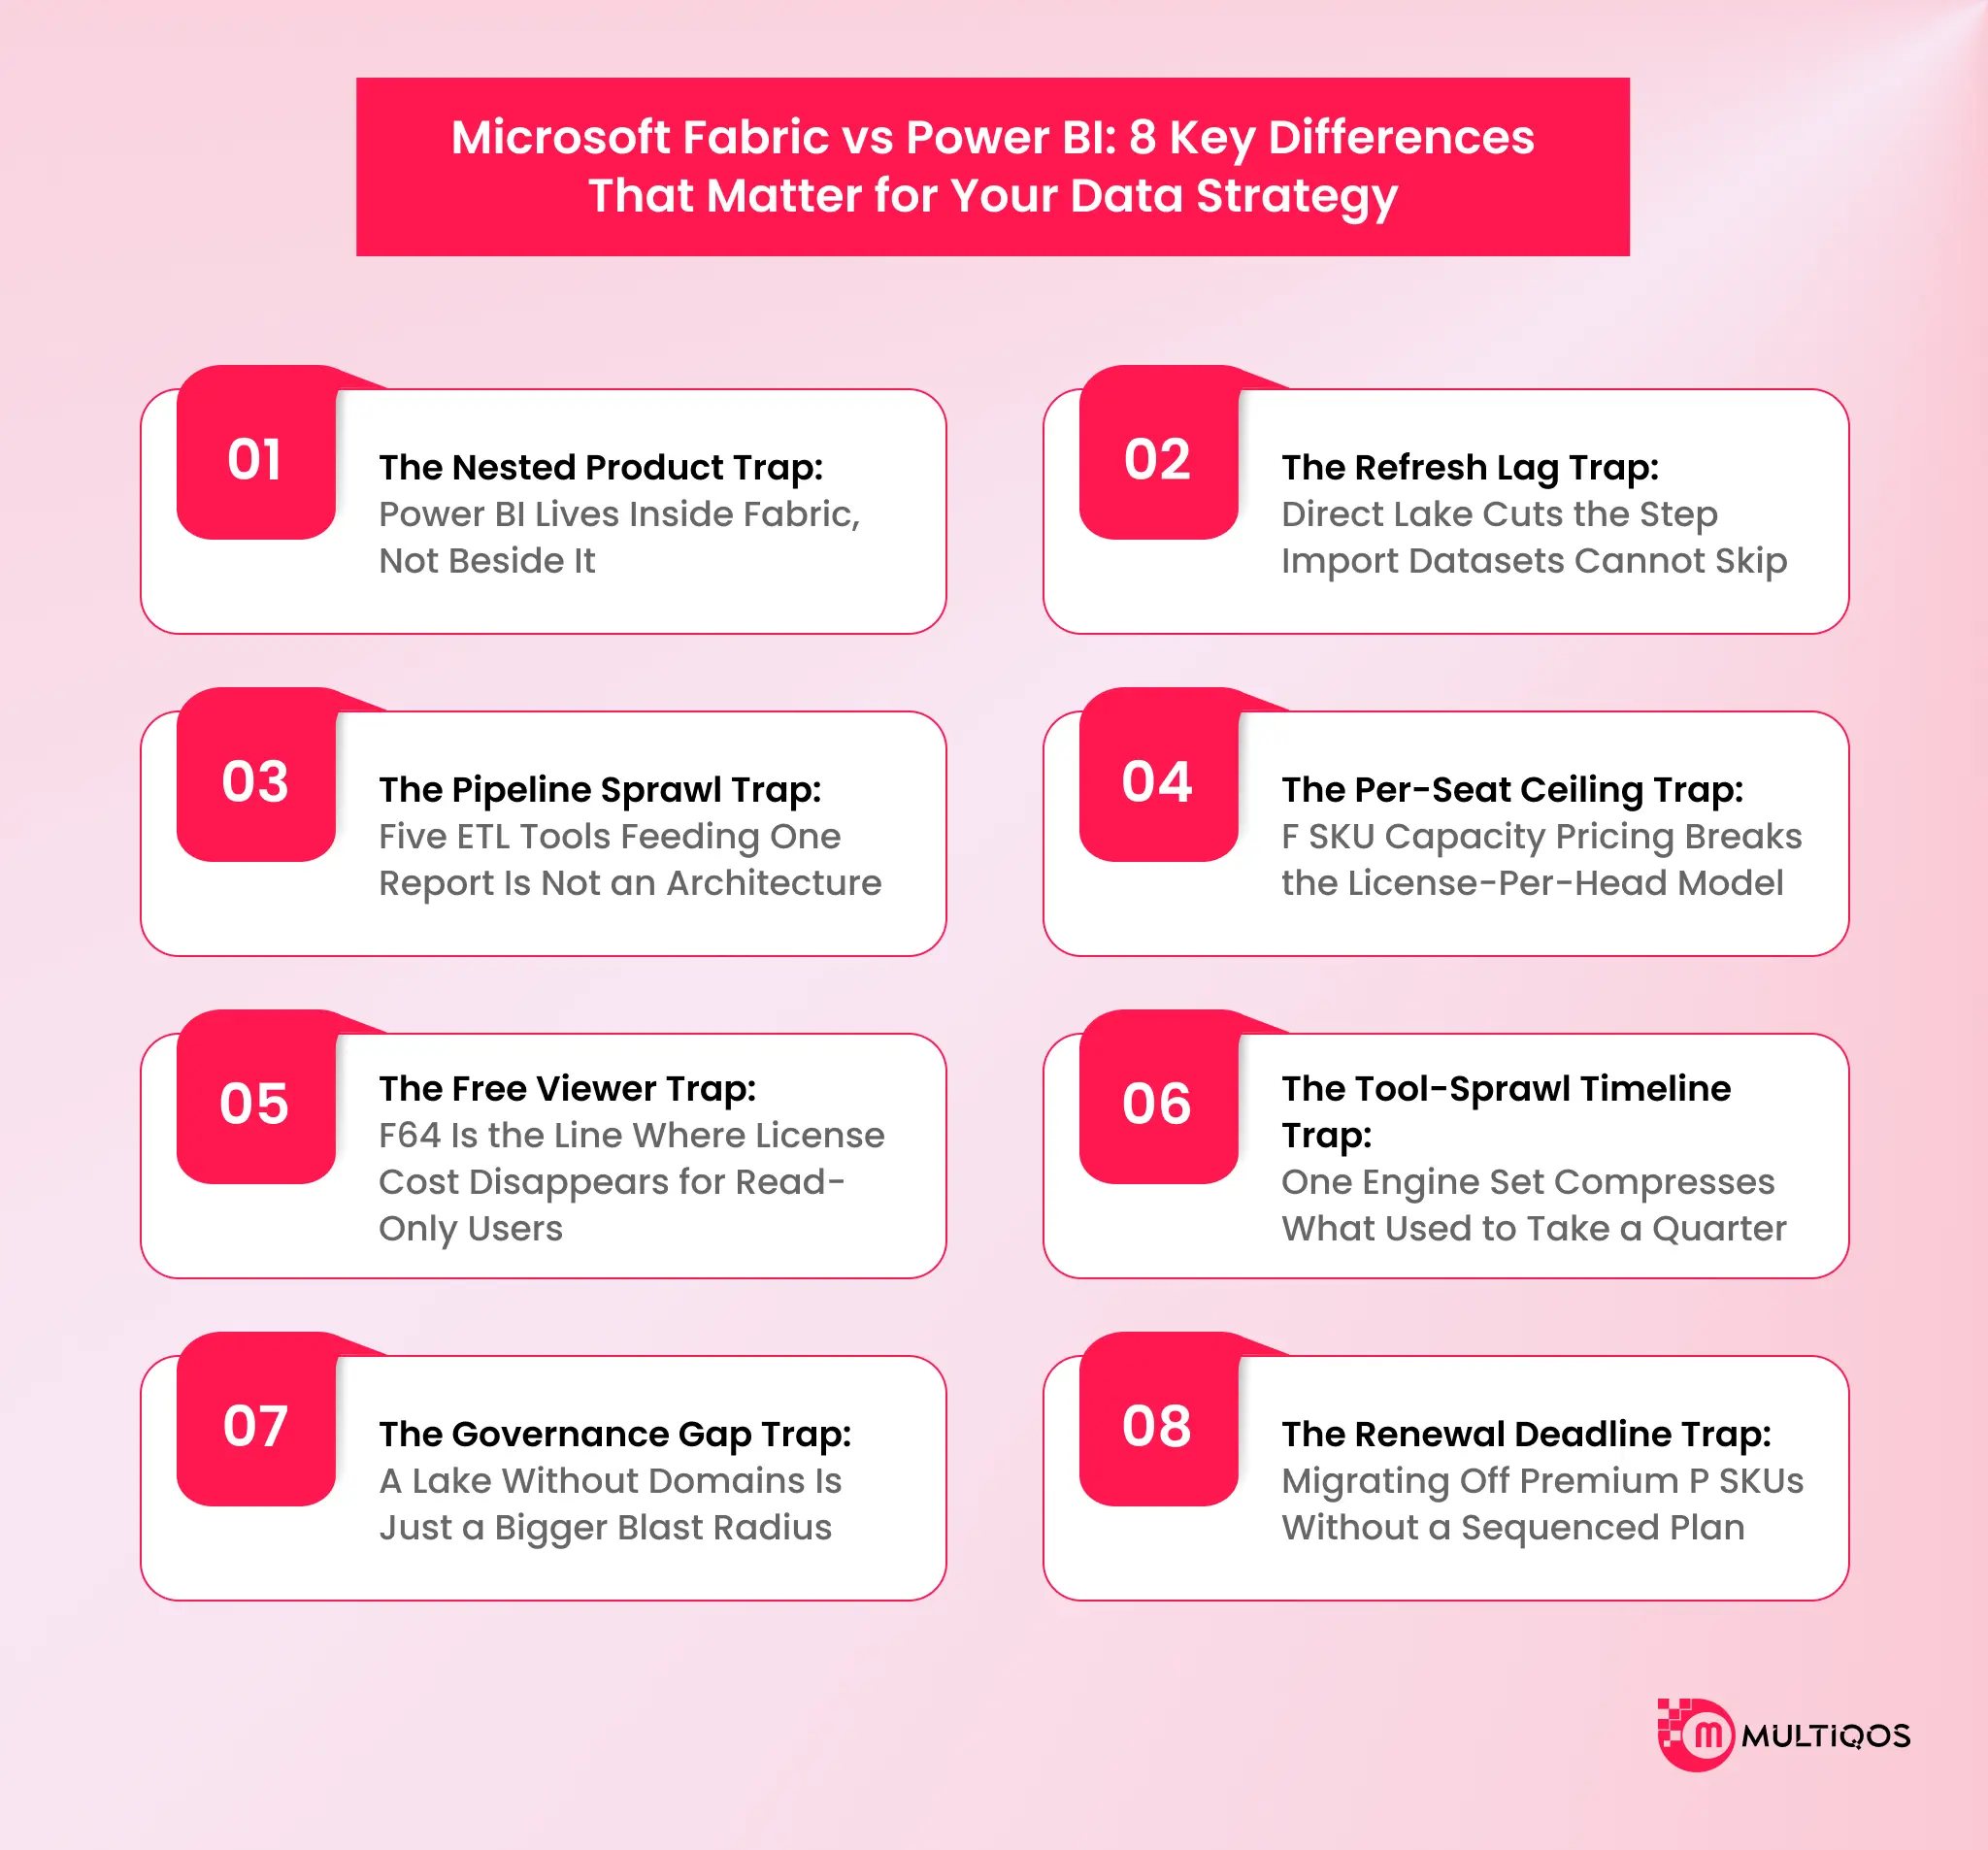
1. The Nested Product Trap: Power BI Lives Inside Fabric, Not Beside It
Most comparison content frames this as tool versus tool. It is not. Power BI is a workload inside Fabric’s licensing model, alongside Data Engineering, Data Factory, Data Science, Data Warehouse, and Real-Time Intelligence. That means every Power BI report your organization already built can run on Fabric capacity without a rebuild.
It also means “moving to Fabric” is not a migration off Power BI. It is a decision to place your existing Power BI estate on a different compute foundation.
The trap triggers when procurement treats the two as competing line items in the same budget review. They are not competitors. They are the same product family at different layers, and pricing them against each other produces a comparison nobody can act on. Teams already running a reporting estate usually get further by auditing it through Power BI consulting services than by re-litigating the product boundary.
2. The Refresh Lag Trap: Direct Lake Cuts the Step Import Datasets Cannot Skip
Traditional Power BI datasets work one of two ways. Import mode copies data into the model and refreshes on a schedule, so your dashboard is only as current as the last refresh job. DirectQuery skips the copy but pays a latency tax on every single visual load, because each interaction fires a live query back to the source.
Direct Lake is Fabric’s third mode, and it reads Delta Parquet files straight out of OneLake without importing them and without the DirectQuery round-trip penalty. The mechanism: the semantic model points directly at the lakehouse tables, so a dashboard reflects what landed in OneLake minutes ago, not what a nightly job copied over last night. That only holds if the lakehouse tables underneath are being written correctly. This is where data engineering services help.
The consumer analogy here is your banking app. You expect your balance to reflect the transaction you just made, not the balance as of yesterday’s overnight batch. Enterprise reporting trained your users on the opposite expectation for a decade. Direct Lake is the piece that finally closes that gap, and it only works if your data already lives in OneLake, which is the whole reason the architecture change matters more than the pricing change.
3. The Pipeline Sprawl Trap: Five ETL Tools Feeding One Report Is Not an Architecture
Ask a Director of Analytics how many tools move data before it reaches Power BI, and the honest answer is usually three to six: an ELT tool, a scheduling layer, a staging database, maybe a reverse-ETL tool bolted on afterward. Each one has its own auth model, its own failure alerts, its own on-call rotation. This is the exact stack data pipeline automation is meant to collapse.
OneLake plus Data Factory pipelines replace that stack with one storage layer and one orchestration surface. The mechanism is structural: because every Fabric workload writes to and reads from OneLake natively, a pipeline built in Data Factory lands data in the exact format Direct Lake, Synapse Data Warehouse, and Real-Time Intelligence all consume without a conversion step.
The consequence chain when this trap stays unaddressed: five tools, five renewal dates, five sets of credentials to rotate, and an incident last quarter where a scheduling tool’s silent failure meant a semantic model quietly served three-day-old data to an executive dashboard for a full sprint before anyone noticed.
That is not a hypothetical. It is the exact failure mode pipeline sprawl produces, and it terminates in a leadership team making a decision on stale numbers. Fixing it upstream is what building an AI-ready data architecture actually means in practice.
4. The Per-Seat Ceiling Trap: F SKU Capacity Pricing Breaks the License-Per-Head Model
Power BI Pro runs $14 per user per month. Premium Per User runs $24 per user per month. Both scale linearly with headcount, which works fine until your analyst population grows faster than your budget does. The Power BI benefits that justify per-seat spend stop compounding at exactly that point.
Fabric’s F SKUs are priced by compute capacity, not by seat. An F64 capacity runs roughly $8,410 per month pay-as-you-go, or about $5,003 per month on a one-year reservation. That capacity is shared across every user and every workload running on it.
Add a hundred report viewers and the F64 bill does not move. Add a hundred Pro-licensed users under the per-seat model, and you have added $1,400 a month, every month, permanently.
The real axis nobody is debating: it is not F64 versus Premium P1 on a feature checklist. It is whether your growth curve is in users or in workload volume. If it is users, the seat model may still win at your scale. If it is workload volume, per-seat pricing is the constraint quietly capping your ceiling, and it caps it at exactly the moment you can least afford a renegotiation.
5. The Free Viewer Trap: F64 Is the Line Where License Cost Disappears for Read-Only Users
Under the standard Power BI model, anyone who opens a report, even to view it, needs a Pro license unless the content sits on Premium capacity. That $14 a month multiplies fast across a 5,000-person org where most people only ever consume dashboards.
Cross the F64 capacity threshold and free users can view Fabric-hosted Power BI content without a Pro license, the same free-viewer benefit Premium capacity already grants. The trigger most finance teams miss: they price Fabric against the per-user Pro math without netting out the licenses an F64 tier eliminates entirely.
Run that arithmetic for a 3,000-viewer org and the per-seat savings alone can offset a meaningful share of the capacity bill, before you have counted a single engineering benefit. Model it against your real consumption pattern, the way a data science and analytics services engagement would, not against list price.
6. The Tool-Sprawl Timeline Trap: One Engine Set Compresses What Used to Take a Quarter
Because Data Engineering, Data Factory, Data Warehouse, Real-Time Intelligence, and Power BI all share OneLake, a data team building a new reporting pipeline is not stitching together separate products with separate deployment cycles anymore.
Microsoft’s own customer accounts describe delivery timelines compressing from months to weeks once the tool count drops and the handoffs between teams disappear.
The mechanism is not magic. It is fewer handoffs. Every tool boundary in a legacy stack is also a team boundary, a ticket queue, and a Slack channel where work waits. Collapse the tool count, and you collapse the queueing delay between them, which is where most enterprise data project time actually goes, not into the engineering work itself.
7. The Governance Gap Trap: A Lake Without Domains is Just a Bigger Blast Radius
When upgrading from Power BI to Microsoft Fabric, the biggest architectural shift was the introduction of OneLake, often pitched as the “OneDrive for data.” While having all your organization’s data natively connected in a single logical data lake sounds like a utopian dream, it can quickly turn into a governance nightmare if you aren’t prepared.
In Microsoft Power BI, data is naturally siloed. You import data into specific datasets tied to specific Workspaces. While this creates data duplication and “single version of the truth” headaches, it inherently limits your risk. If a workspace admin accidentally misconfigures a dataset’s security, the blast radius is confined to that specific workspace.
Microsoft Fabric breaks down these silos. Data is stored once in OneLake in open Delta Parquet format, and multiple compute engines (Synapse, Power BI, Data Factory) point to it. If you treat OneLake like a giant, unstructured shared drive and simply dump all your corporate data into a flat workspace structure, a single misconfigured access policy could expose sensitive HR or Financial data to the entire company.
8. The Renewal Deadline Trap: Migrating Off Premium P SKUs Without a Sequenced Plan
Microsoft is retiring the Power BI Premium per-capacity P SKUs and moving customers to F SKUs, and every org still on a P SKU has a renewal date already on the calendar that forces this decision whether or not the rest of the org is ready.
The trap is treating the migration as a lift-and-shift of capacity size, P1 to F64, without re-evaluating what actually runs on that capacity. A P1 estate built five years ago is carrying reports, dataflows, and dataset refresh schedules nobody has audited since. That audit is standard scope in Microsoft consulting services work, and it is the step most orgs skip.
Moving that estate onto F SKU capacity unaudited just moves the technical debt onto a new billing model. Sequence the migration instead: audit what is actually running, decommission what is not, then size the F SKU against real, current workload, not against the SKU you happened to already own.
Which One Should You Choose: A Decision Framework
The comparison table told you where the platforms differ. This section tells you which side of that difference your org is actually standing on.
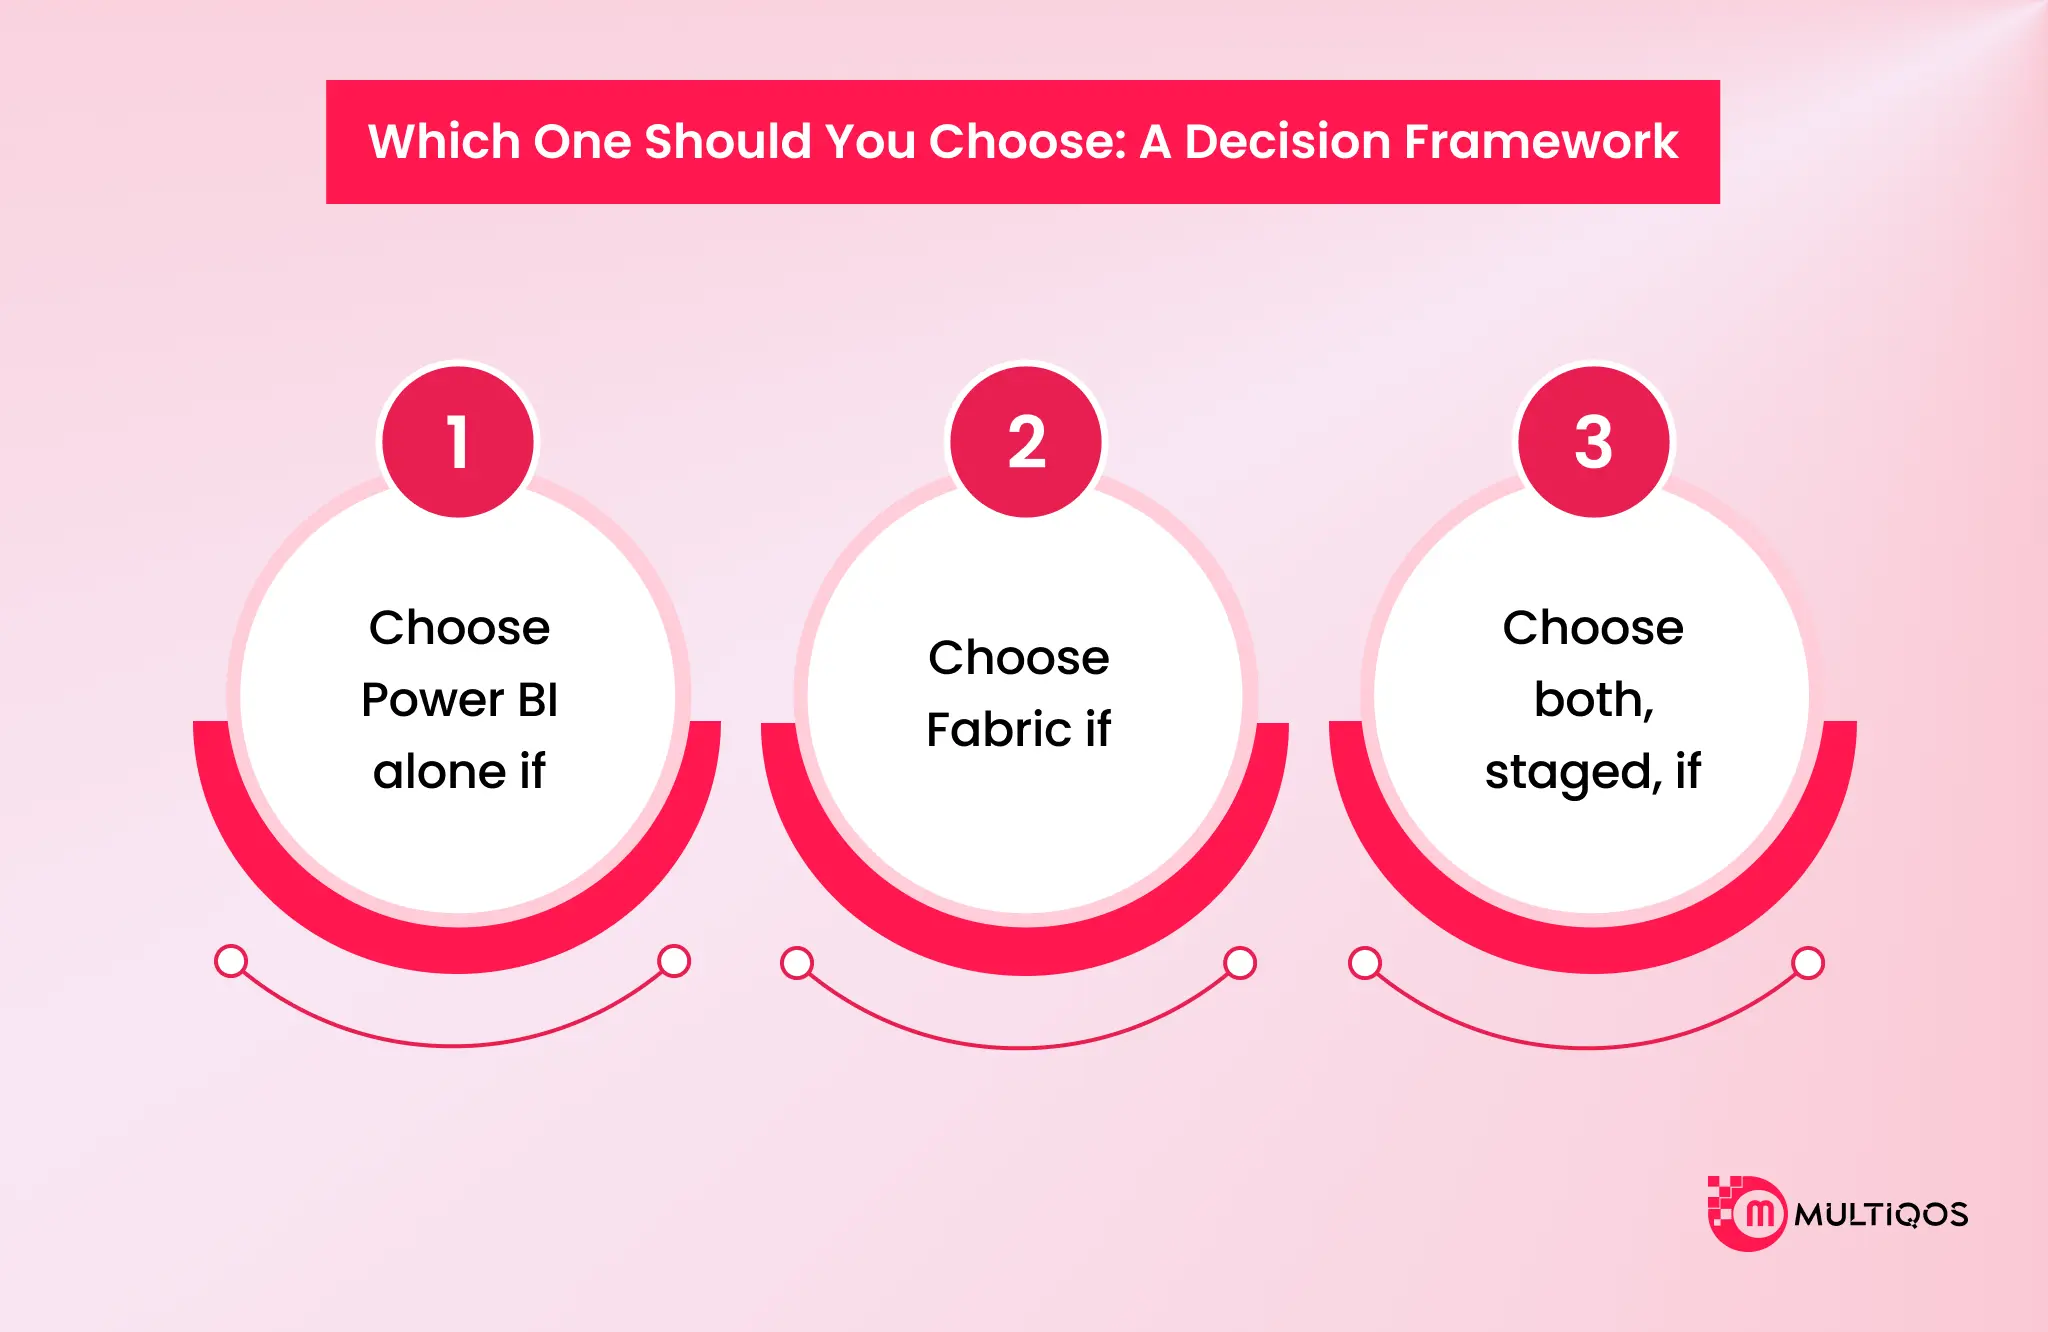
Choose Power BI alone if: your data already lands in a clean, well-governed warehouse or lakehouse elsewhere, your reporting team has no unmet need for native pipelines or real-time ingestion, and your user growth is the primary cost driver, not workload volume. The per-seat model still makes sense here, and a Fabric migration would buy engineering capability you have no near-term use for.
Choose Fabric if: you are already paying for a separate ETL tool, a separate warehouse, and Power BI Premium, and consolidating those bills onto one OneLake foundation nets out cheaper than the sum of the parts. This is also the answer if your Premium P SKU renewal is forcing a decision regardless, because F SKU is where that renewal is heading either way.
Choose both, staged, if your reporting layer is stable, but your data engineering layer is the actual bottleneck. Move the pipeline and warehouse workloads to Fabric first, on a modest F capacity, while your existing Power BI Premium or Pro licensing continues serving reports unchanged. Add the Direct Lake and free-viewer benefits once the F SKU is already proven on the engineering side.
A 90-day evaluation sequence to choose between the Microsoft Fabric vs Power BI
- Weeks 1 to 2: Audit the current estate. Every dataset, every refresh schedule, every ETL tool feeding Power BI today, and who actually consumes each report.
- Weeks 3 to 6: Stand up a trial F SKU (F2 or F4) and migrate one non-critical pipeline plus its downstream semantic model to Direct Lake mode. Measure refresh latency and query performance against the current setup.
- Weeks 7 to 10: Price the real F SKU tier against your actual user and workload count, netting out any Pro licenses the F64 free-viewer threshold would eliminate. Compare that number to your current Premium or Pro spend, not to a vendor’s list price.
- Weeks 11 to 12: Decide, sequence the rollout, and set the domain and Purview governance boundaries before a single additional workload moves, not after.
If your team cannot answer where the bottleneck actually sits, in the report layer or upstream of it, that answer is worth getting from an outside audit before a capacity number gets locked into a renewal contract.
MultiQoS runs Microsoft Fabric and Power BI assessments that map your current estate against real workload data, not a feature checklist, and size the migration before you commit spend to it.
Final Thoughts
The choice was never Microsoft Fabric versus Power BI. It was always a question of where your bottleneck actually sits: in the report layer your analysts already own, or upstream of it, in the pipelines, warehouse, and governance boundaries that decide what those reports are even allowed to show.
Everything in this piece the licensing arithmetic, the eight traps, the 90-day sequence- exists to help you locate that bottleneck honestly before a renewal date forces a guess. Find it there, and the platform decision mostly makes itself.
FAQs
No. Power BI is a workload inside Microsoft Fabric, not a separate product being phased out. Your existing Power BI reports, datasets, and dashboards run unchanged on Fabric capacity, and Microsoft continues to develop Power BI as one of Fabric’s seven core workloads alongside Data Engineering and Real-Time Intelligence.
Only if your bottleneck sits upstream of reporting; if your data pipelines, warehouse, and governance are handled by other tools that work fine, Power BI alone can remain sufficient. Fabric earns its cost when you are already paying separately for ETL, warehousing, and Premium capacity that OneLake could consolidate.
No. PPU provides the Premium features of Power BI to an individual user, not Fabric’s Data Engineering, Data Factory, Data Warehouse, or Real-Time Intelligence workloads. Those need an F SKU capacity, which is in addition to any per-user Power BI license.
Only if the F64 capacity threshold is exceeded. Similarly, as users reach F64 capacity, they will be able to view Power BI content on that capacity without having to purchase a Pro license, just as they already could do with Premium capacity prior to the creation of Fabric.
The per-capacity P SKUs are being phased out and replaced with SKUs with an F suffix, but Power BI will not be discontinued, for organizations subscribing to Premium P SKUs, the migration to F SKU capacity needs to be done before the renewal date, as Microsoft has already triggered the migration timeline.

Get In Touch

Get Stories in Your Inbox Thrice a Month.
Microsoft IQ Explained: The Role of Fabric IQ, Foundry IQ, Work IQ, and Web IQ
Building Automated Approval Workflows with Microsoft Power Automate
Paper Checklists to Power Apps for Manufacturing: Digitizing Shop-Floor Workflows